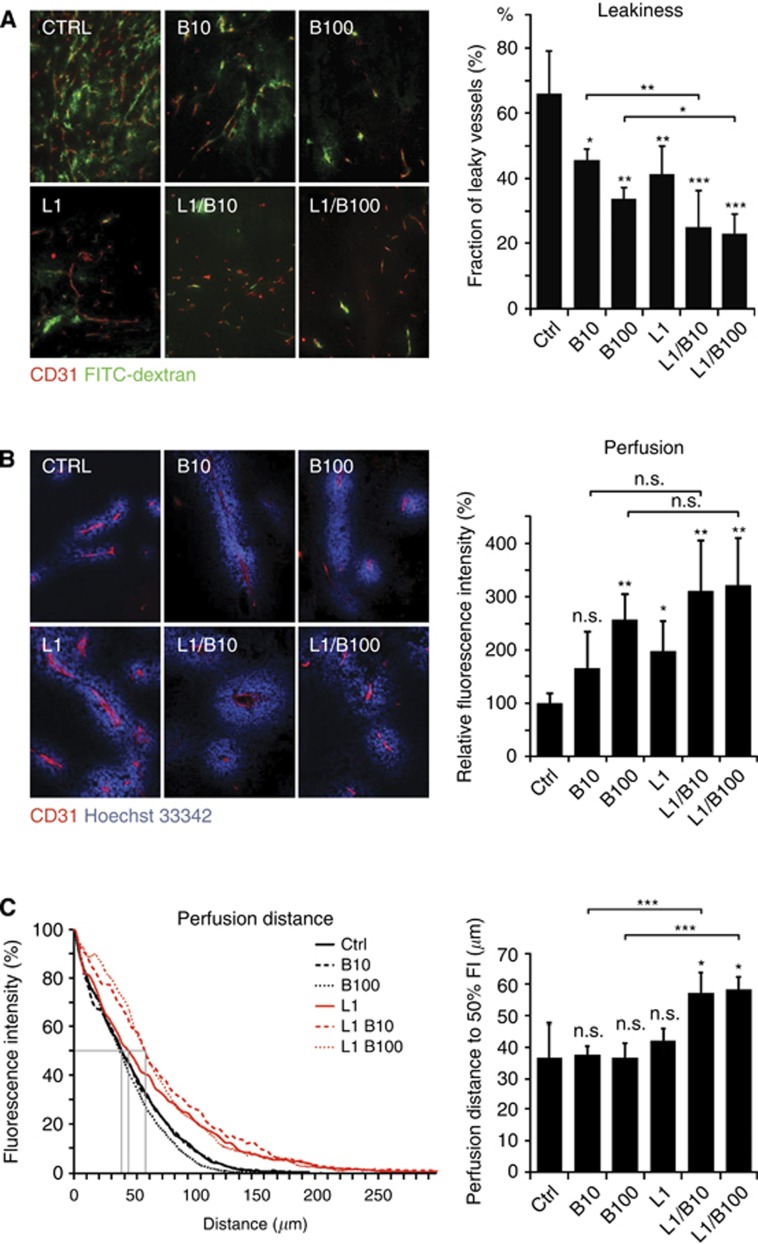
Figure 3.
Treatment-related changes in endothelial barrier function and tumour perfusion. (A) Tumour vessels (CD31, red) perfused with or leaking FITC-dextran (green) 30 min after tail-vein injection detected in cryosections of LS174T tumours and quantification of the fraction of leaky blood vessels in each treatment group. (B) Perfusion of LS174T tumours with Hoechst-33342 dye (blue) 3 min after tail-vein injection. Blood vessels were stained with CD31 (red). Quantification of the area density of Hoechst-33342 per area density of CD31 based on multiple alignment images. There was a trend towards improved perfusion upon addition of L1 to B10 or B100 but this did not reach statistical significance. (C) The perfusion distance represents the radial distance of Hoechst-33342 signal intensity along the gradient measured from the vessel lumen into the peripheral tumour tissue and quantification of the perfusion distance until the half maximal intensity was reached. In the dual inhibition groups (L1/B10 and L1/B100), the perfusion distance is >50% greater than in controls or tumours or tumours treated with either Ang2 or VEGF inhibition alone. Symbols above individual bars indicate statistical significance vs the control group. Symbols above brackets indicate the statistical significance between these two groups. For a comprehensive statistical comparison of the treatment groups, please refer to Supplementary Table 1. *P≤0.05, **P≤0.01, ***P≤0.001.

