Figure 3.
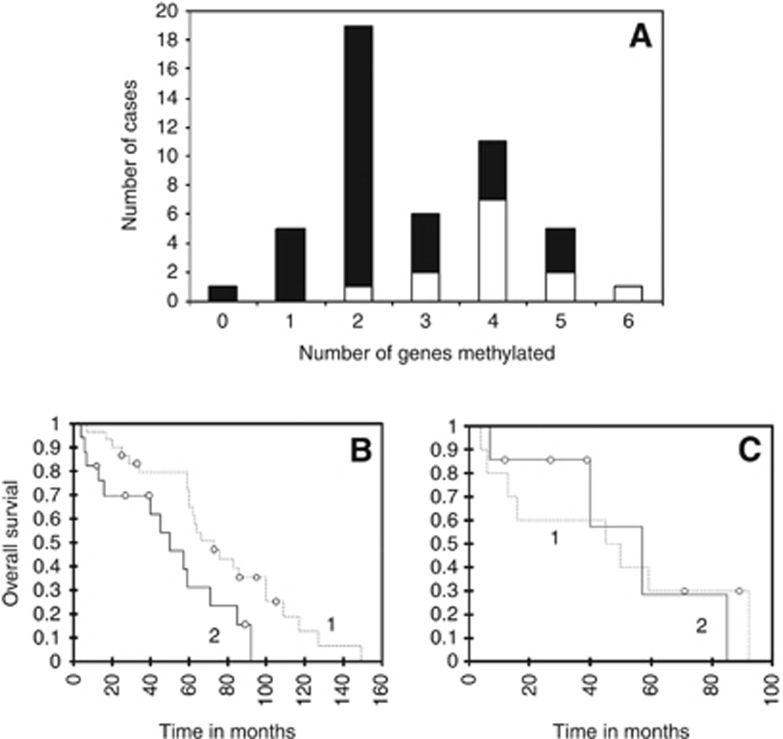
Hypermethylated phenotype in NETs. In A, the distribution of tumours according to the number of methylated genes detected in tumour tissue is given. Open bars represent cases with methylated MGMT; solid bars represent cases with non-methylated MGMT. In B, overall survival curves from diagnosis are compared between patients with tumours containing ⩽3 methylated genes (group 1) and those with tumours containing >3 methylated genes (group 2). The difference is statistically significant (log-rank test, P=0.017). In C, overall survival curves from diagnosis are compared for the subset of patients with tumours containing >3 methylated genes according to their MGMT status (group 1: methylated MGMT, group 2: non-methylated MGMT). The difference is not statistically significant.

