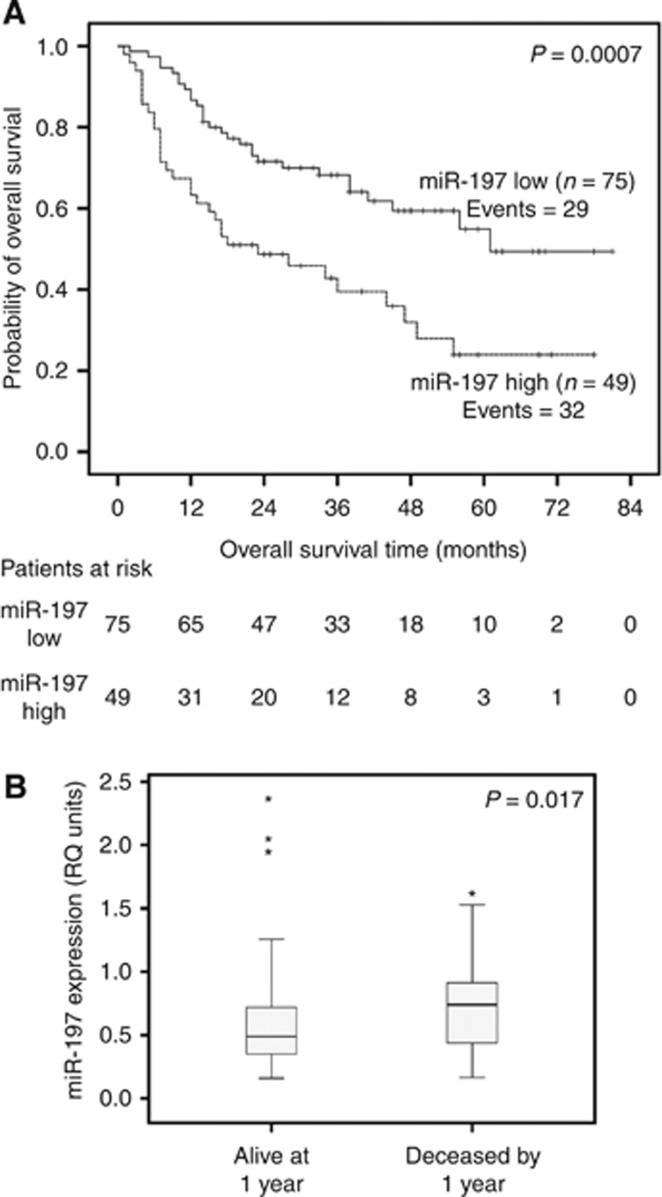
Figure 2.
Association of miR-197 expression with unfavourable prognosis in the whole cohort of NSCLC patients. (A) Kaplan–Meier OS curves for the whole cohort of NSCLC patients, classified as miR-197-high and miR-197-low. P-value calculated by the log-rank test. (B) MiR-197 expression levels in NSCLC patients deceased by 1 year and alive at 1 year post surgery. P-value calculated by the Mann–Whitney U-test. Bold lines represent the median value. *Outliers.

