Figure 1.
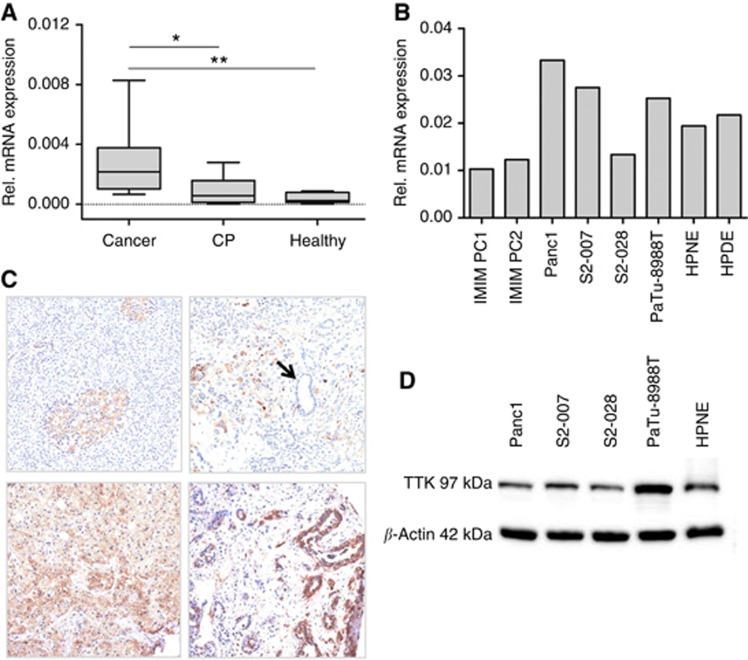
TTK expression in primary pancreatic tumour tissues and cell lines. TTK mRNA and protein levels were examined in primary pancreatic cancer and control tissues as well as in cultured pancreatic cancer and control cell lines. (A) Box-and-whisker plot showing TTK mRNA expression in primary human pancreatic tumour tissue samples, chronic pancreatitis and normal pancreas as analysed by quantitative real time reverse transcription PCR (qRT-PCR). Expression was normalised to ribosomal protein, large, P0 (RPLP0) mRNA levels. Data in figure represent median and 2nd and 3rd quartiles (boxes) as well as minimum and maximum values (whiskers). CP=Chronic pancreatitis. *P<0.05; ** P<0.01 (Student's t-test). (B) TTK mRNA expression levels in a variety of different pancreatic cancer and control cell lines. (C) Immunohistochemical staining of tissue microarrays (TMA) for TTK expression. In normal pancreatic tissue, Langerhans islets were stained positive for TTK, whereas normal acinar and ductal cells showed only very faint signal (top left panel). Enhanced expression was seen in the PDAC tissues (top right as well as bottom panels). Normal ducts stained negative for TTK (see arrow, top right panel). (D) Western blot analyses showing TTK expression in the different pancreatic cancer and control cell lines used for the functional experiments. Beta-actin served as loading control.

