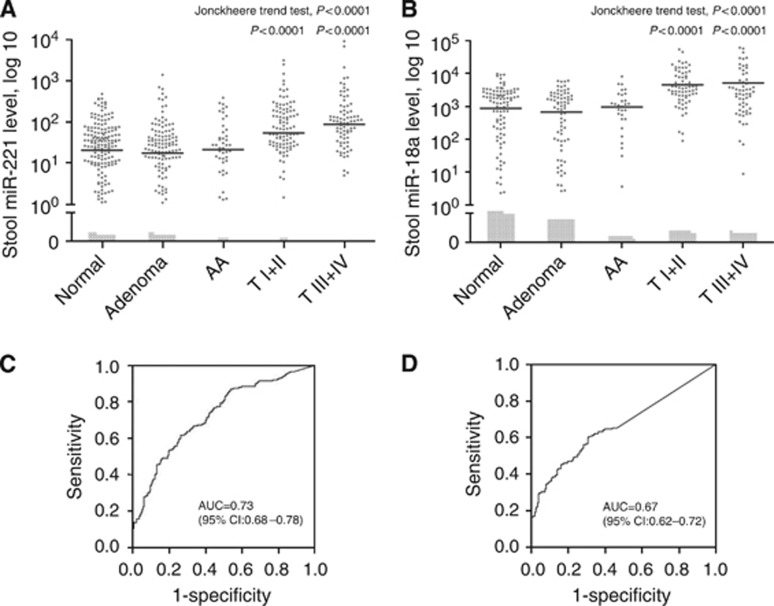
Figure 1.
Levels of candidate markers in stool (A) miR-221 and (B) miR-18a, and their respective receiver operating characteristic (ROC) curves (C) miR-221 and (D) miR-18a. Patients were categorised into four groups: individuals with a normal colonoscopy (normal) (n=124), adenoma (n=72), advanced adenoma (AN) (n=48), CRC stages I+II (T1, 2) (n=24) and CRC stages III+IV (T3, 4) (n=76). The miRNA levels were expressed as the number of copies per nanogram of extracted RNA. Open circles represent samples with an undetectable miRNA level. The lines denote the medians. P<0.05 denotes statistical significance. ROC curves were plotted to discriminate all CRC patients from individuals with normal colonoscopy findings.

