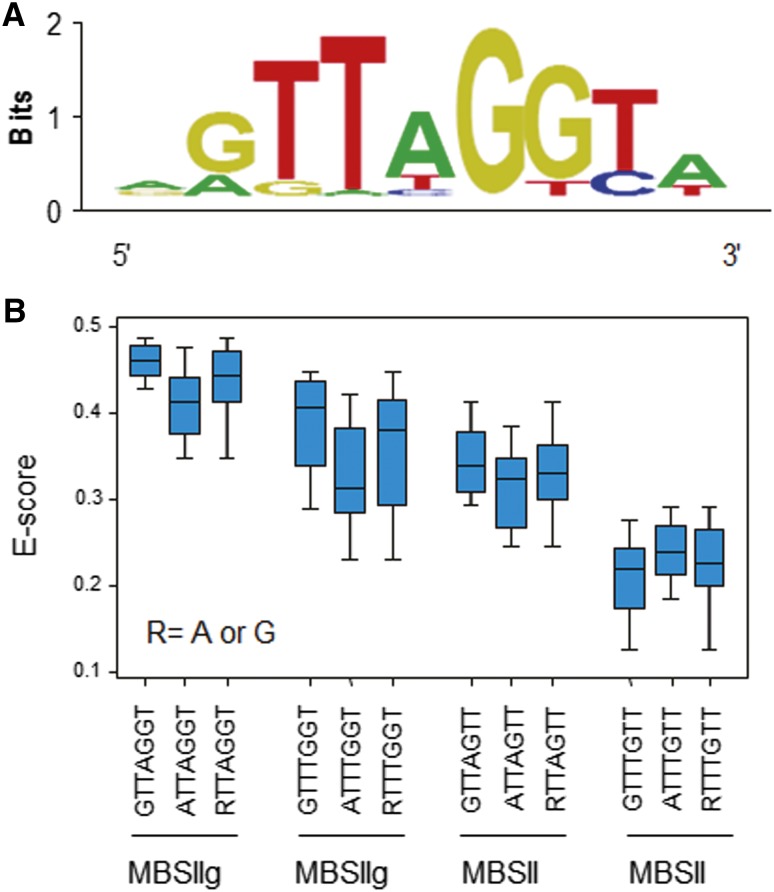
Figure 10.
Identification of FaEOBII-binding motifs in vitro. A, Position weight matrix representation of the top-scoring 9-mer obtained in the seed-and-wobble algorithm. B, Box plot of enrichment scores (E-scores) containing all possible 7 mers indicated representing the MBSIIg and MBSII elements. Blue boxes represent quartiles 25% to 75%, and the black line represents the median of the distribution (quartile 50%). Bars indicate quartiles 1% to 25% (above) and 75% to 100% (below).

