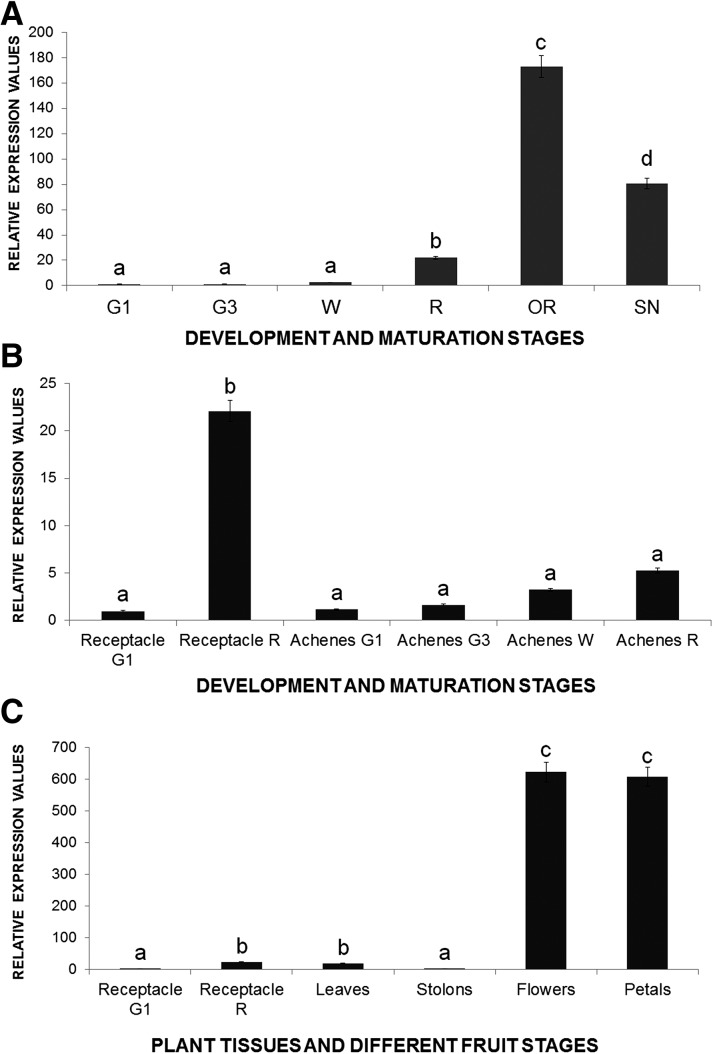
Figure 2.
Analysis by qRT-PCR of FaEOBII expression in developing fruit receptacles (A), achenes (B), and plant tissues (C) of F. ananassa ‘Camarosa.’ G1, Small-sized green fruit; G3, full-sized green fruit; W, white stage; R, ripe stage; OR, overripe stage; SN, senescent stage. Quantification is based on cycle threshold (Ct) values. Relative expression values were calculated relative to receptacles in the G1 stage in all cases, which was assigned an arbitrary value equal to unity. Values are means ± sd of five independent experiments. Statistical significance was determined by one-way ANOVA. Letters indicate significant differences (P < 0.05, Scheffe’s post hoc test).

