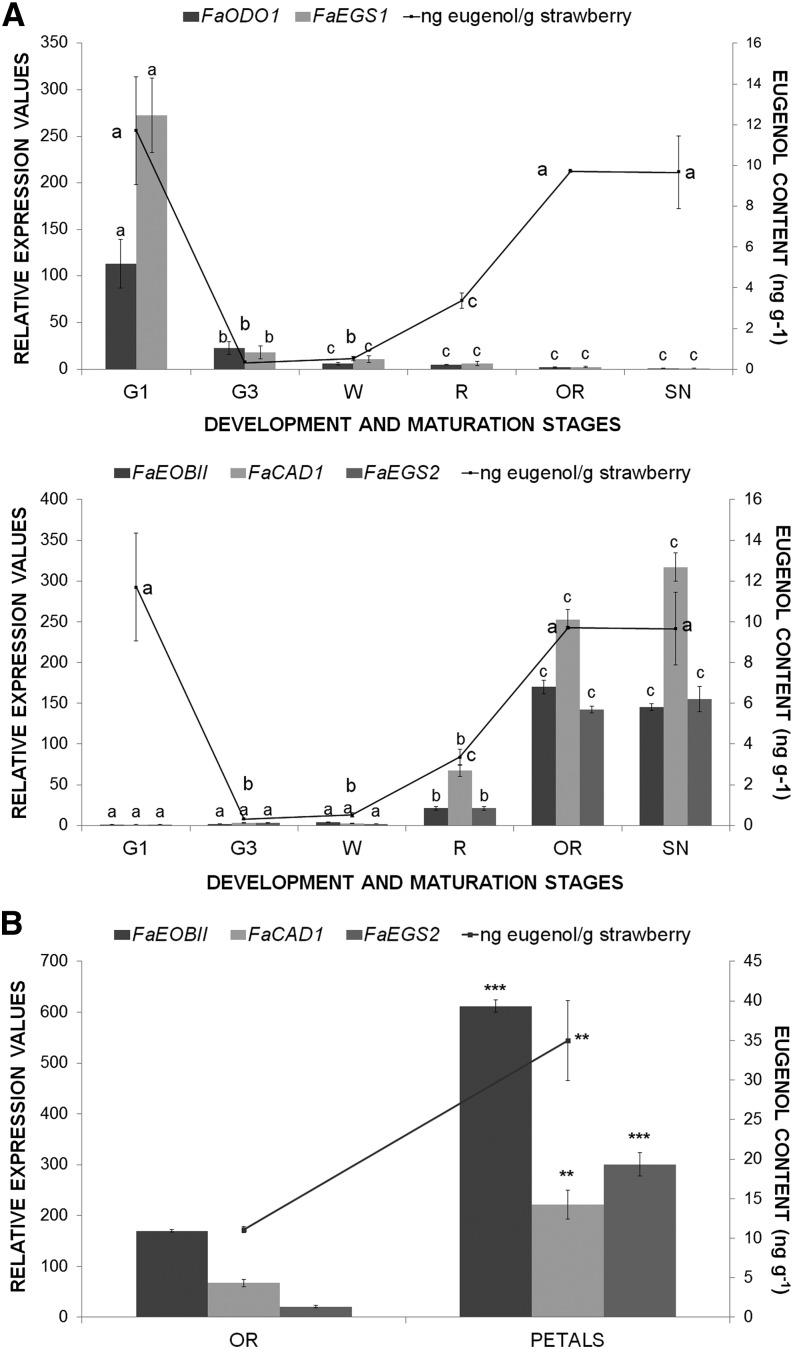
Figure 3.
Analysis of spatiotemporal changes in gene expression and content of eugenol. A, Bars represent the developmental expression of strawberry FaODO1, FaEGS1, FaEOBII, FaCAD1, and FaEGS2 genes in receptacles of F. ananassa ‘Camarosa’ obtained by qRT-PCR. B, Bars represent relative expression values of FaEOBII, FaCAD, and FaEGS2 genes in overripe receptacles versus petals. Stages are as defined in Figure 2. Lines represent gas chromatography (GC)-mass spectrometry (MS) quantification of eugenol. Values are given in nanograms of eugenol per gram of strawberry. One-way ANOVA was performed on log-transformed data, and letters indicate significant differences (P < 0.05, lsd post hoc test).

