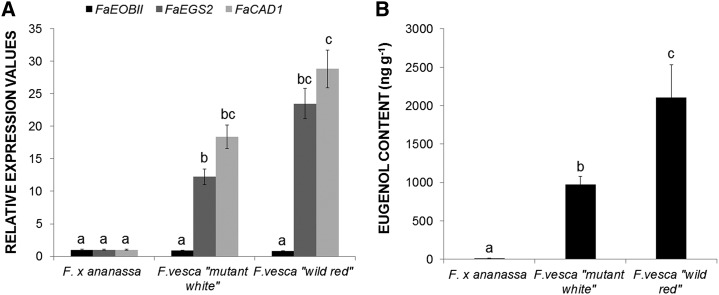
Figure 4.
Analysis of gene expression changes and eugenol content. A, Analysis by qRT-PCR of EOBII, EGS2, and CAD1 gene expression in red ripe receptacles of the cultivated strawberry F. ananassa ‘Camarosa’ and in the wild strawberries F. vesca Mutant White and F. vesca Wild Red of cv Reina de los Valles. Quantification is based on Ct values as described in “Materials and Methods.” The increase in the mRNA value was relative to the F. ananassa Ct value of each experiment, which was assigned an arbitrary value equal to unity. Mean values ± sd of six independent experiments are shown. Statistical significance was determined by one-way ANOVA. Letters indicate significant differences (P < 0.05, Scheffe’s post hoc test). B, GC-MS quantification of eugenol in strawberry fruit varieties. Values are given in nanograms of eugenol per gram of strawberry. One-way ANOVA was performed on log-transformed data, and letters indicate significant differences (P < 0.05, lsd post hoc test).

