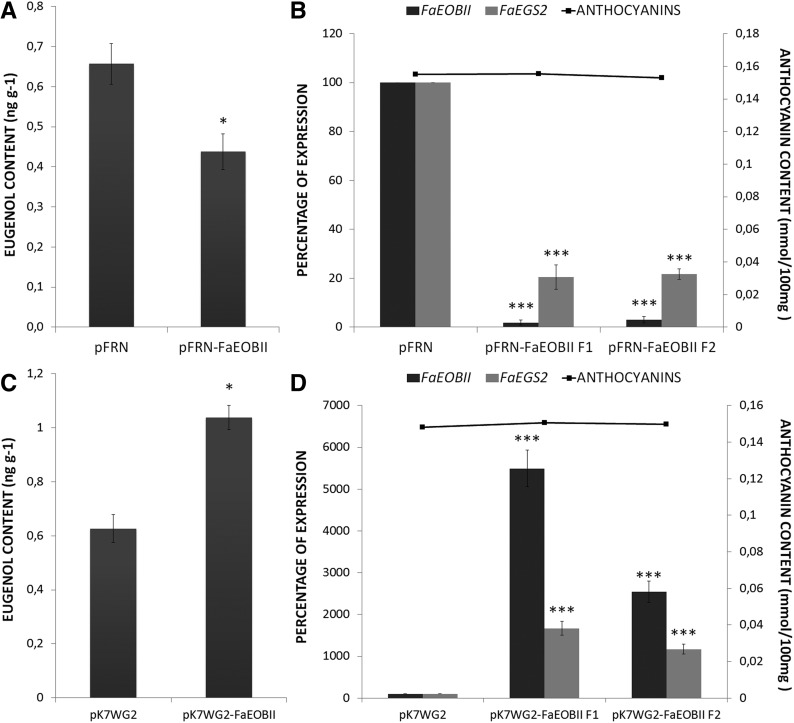
Figure 8.
GC-MS quantification of eugenol, qRT-PCR analysis, and anthocyanin measurements in FaEOBII transitory transgenic fruit receptacles. A and C, GC-MS quantification of eugenol in strawberry fruit receptacles with FaEOBII expression silenced (pFRN-FaEOBII) with respect to control fruits (pFRN; A) and FaEOBII expression increased (pK7WG2-FaEOBII) with respect to control fruits (pK7WG2; C). Values are given in nanograms per gram. Statistical significance with respect to the reference sample (pFRN or pK7WG2) was determined by Student’s t test: *, P < 0.05. B and D, Bars represent the analysis by qRT-PCR of FaEOBII and FaEGS2 expression in transgenic strawberry fruits agroinfiltrated with the pFRN-FaEOBII construct and in control fruits agroinfiltrated with the empty pFRN vector (B) and with the pK7WG2-FaEOBII construct and in control fruits agroinfiltrated with the empty pK7WG2 vector (D). The silencing and overexpression levels are expressed as percentages. Quantification is based on Ct values as described in “Materials and Methods.” The values refer to the mRNA Ct value of control samples, which were assigned an arbitrary value equal to unity. Mean values ± sd of three independent experiments are shown. Lines represent anthocyanin content quantified on fruits analyzed. Statistical significance with respect to the reference sample (pFRN or pK7WG2) was determined by Student’s t test: ***, P < 0.001.

