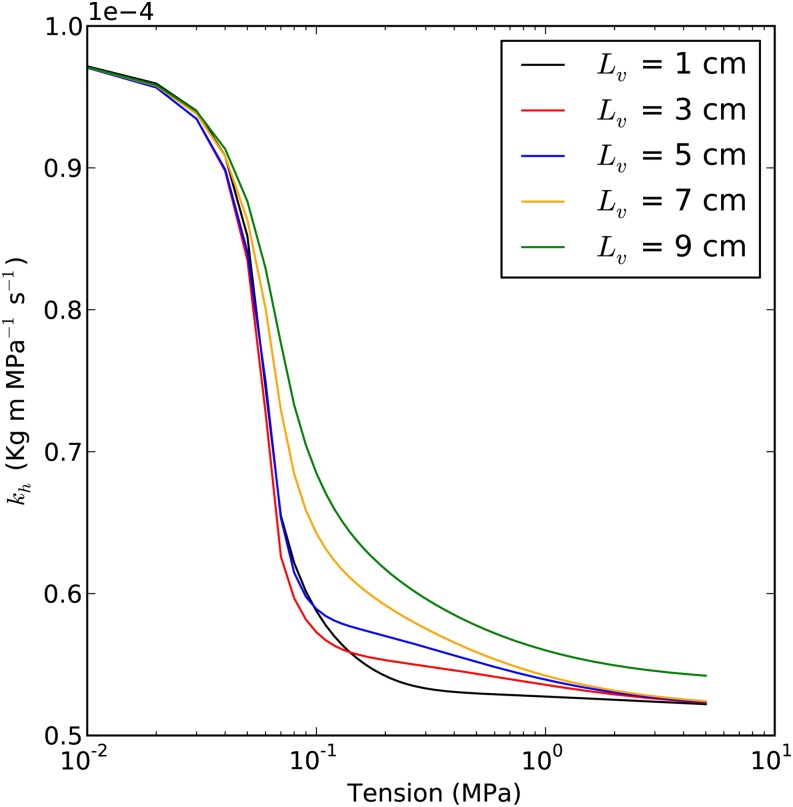
Figure 6.
Prediction of the kh curve with different average Lv values. Each curve is based on a different average Lv of the stem (1, 3, 5, 7, and 9 cm, as shown in the key). Maximum kh is 1E-4 kg m MPa−1 s−1; average Pb*) is 50 kPa; capillary pressure is 12 kPa; and ε in the embolized segment is 50%.

