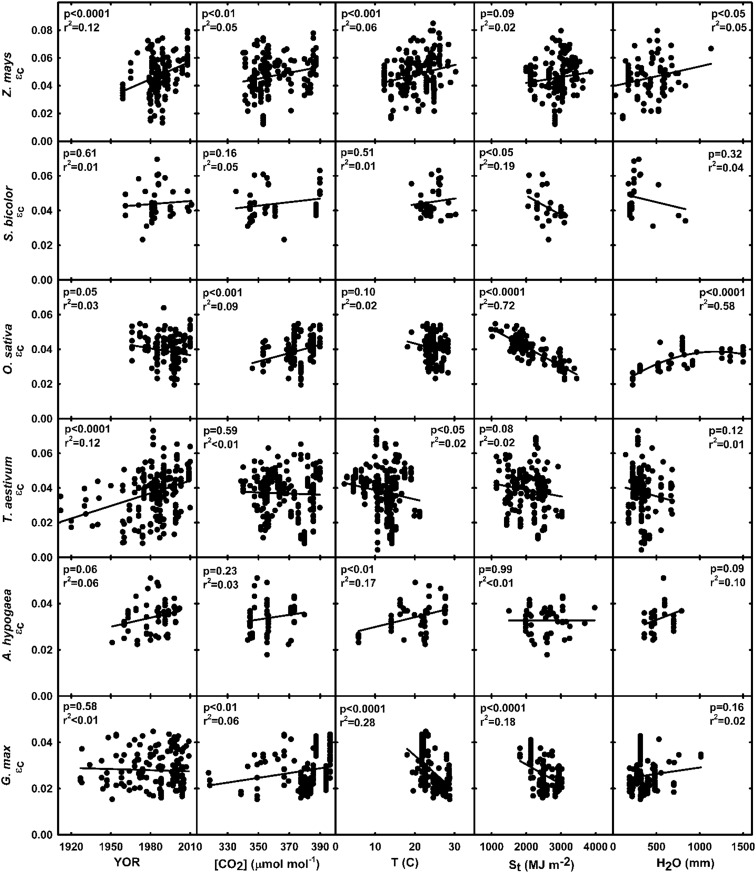
Figure 4.
Relationships between εc and individual independent variables in six major food crops. Independent variables included YOR, mean annual [CO2] during the measurement period, T, available St, and water available during the growing season as precipitation and irrigation (H2O). Lines represent least-squares regression, with corresponding significance levels and correlation coefficients in each graph. εc versus density in maize is not shown.

