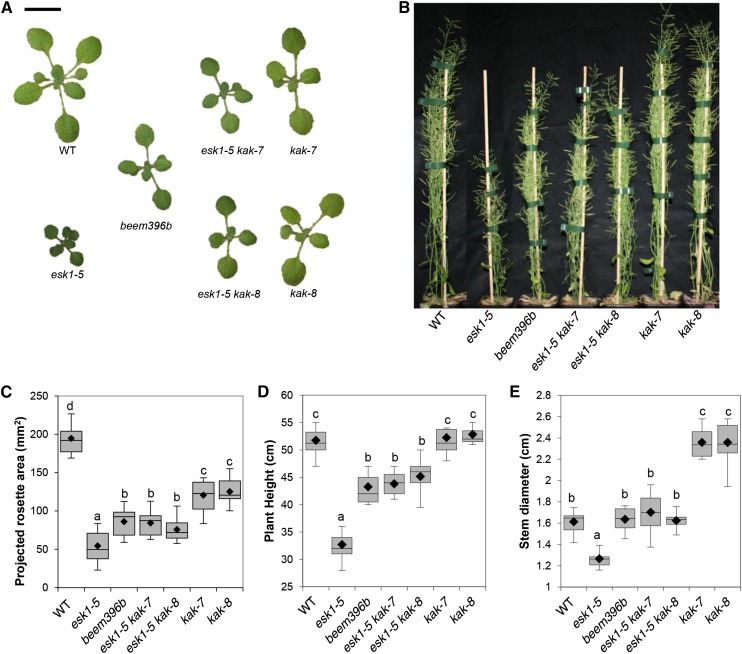
Figure 1.
Partial suppression of esk1-5 dwarfism by kak mutations. A, Rosettes of 2-week-old plants. Bar = 1 cm. B, Twelve-week-old mature plants. Bar = 5 cm. C, Rosette area of 2-week-old plants. D, Length of the main inflorescence stem of mature 12-week-old plants. E, Diameter of the main inflorescence stem of mature 12-week-old plants. WT, Wild type. In C to E, the box and whisker plots show the distribution of 12, eight, and eight measurements, respectively. Black diamonds represent the means, lines represent medians, top and bottom ends of the boxes represent the first and third quartiles, respectively, and whisker extremities represent maximum and minimum data points. Letters above the boxes indicate groups with significant differences as determined by Tukey’s multiple pairwise comparisons test.

