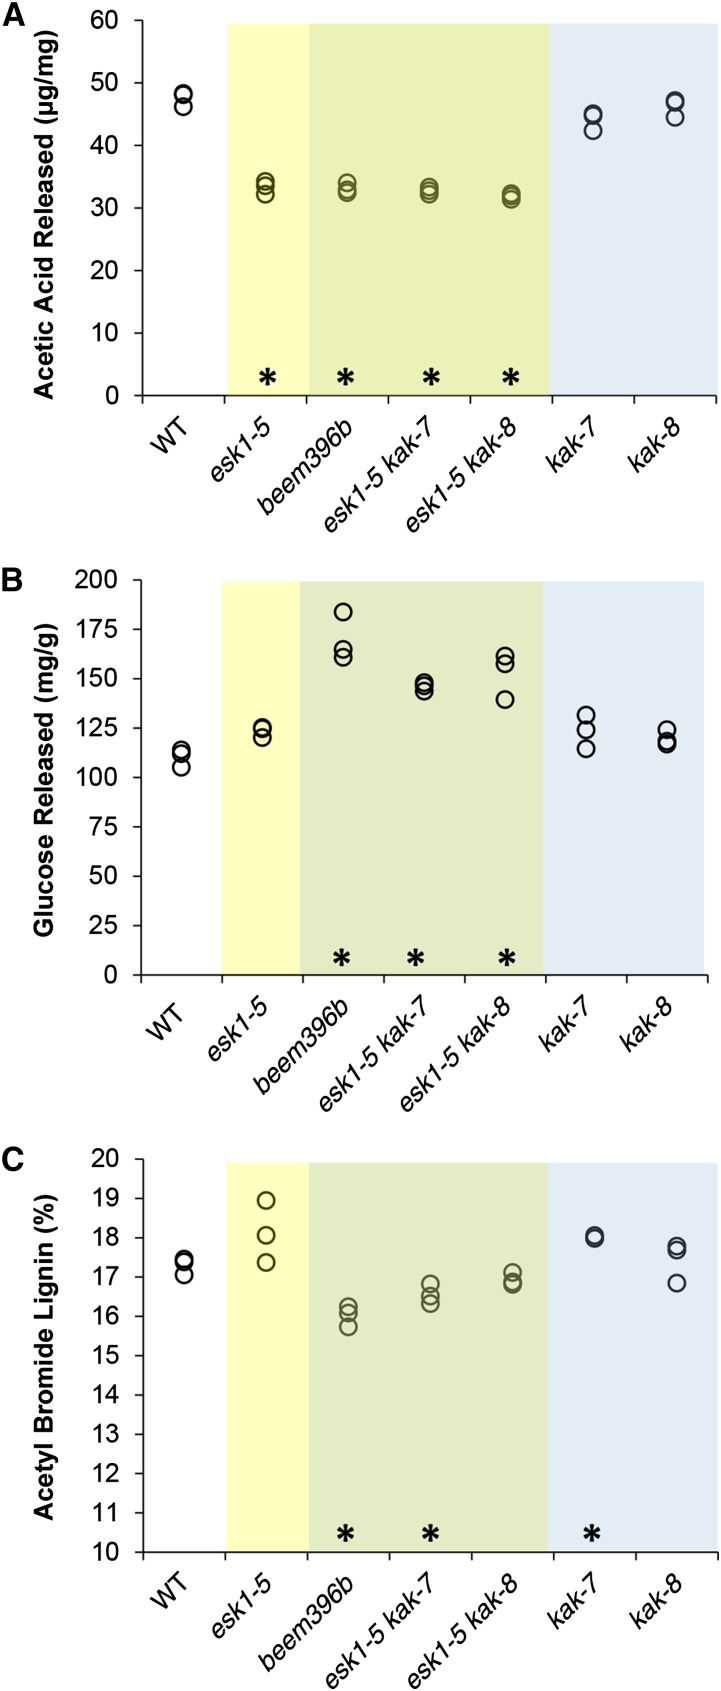
Figure 3.
esk1 kak double mutants show higher Glc release. The same cell wall samples were analyzed for their acetate content (A), Glc release after cellulase digestion (B), and acetyl bromide lignin (C). The values of three biological replicates are shown (circles). Data from genotypes carrying the esk1 mutation are presented on a yellow background, data from genotypes carrying the esk1 and kak mutations on a green background, and data from genotypes carrying the kak mutation on a blue background. Asterisks over the x axis indicate statistically significant differences compared with the wild type (WT; Dunnett’s test, P < 0.05; n = 3).

