Figure 4.
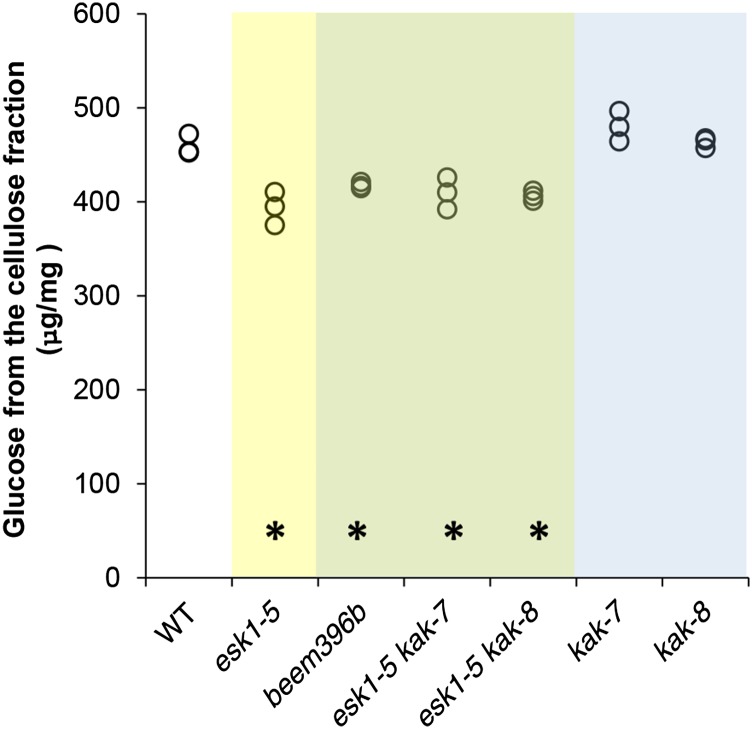
kak does not suppress the cellulose content of esk1-5, as indicated by Glc dosage from the cellulose fraction. The values of three biological replicates are shown (circles). Data from genotypes carrying the esk1 mutation are shown on a yellow background, data from genotypes carrying the esk1 and kak mutations on a green background, and data from genotypes carrying the kak mutation on a blue background. Asterisks over the x axis indicate statistically significant differences compared with the wild type (WT; Dunnett’s test, P < 0.05; n = 3).

