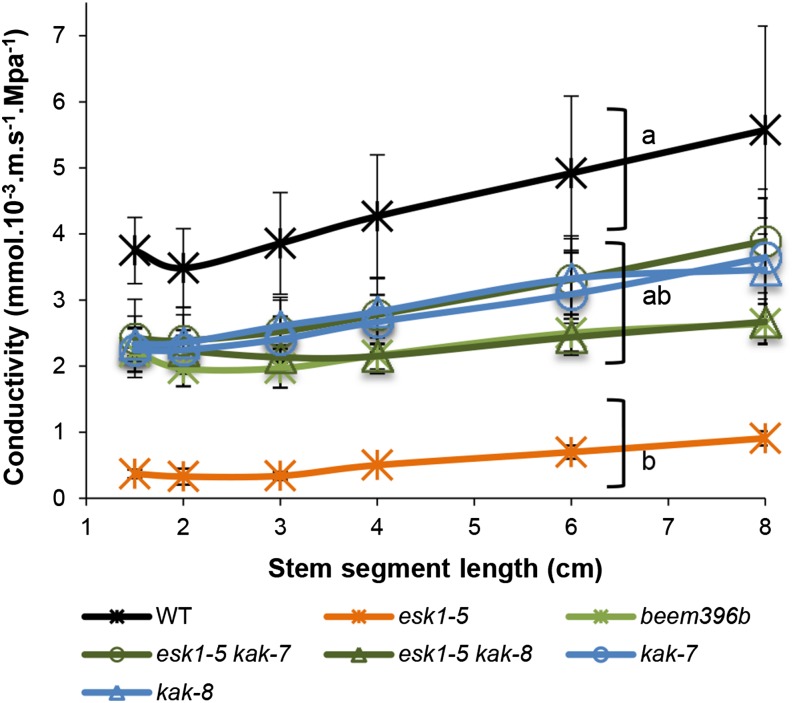
Figure 6.
kak partially suppress the conductivity default of esk1-5. Hydraulic conductivity was measured on segments of basal inflorescence stems sequentially shortened and plotted as a function of segment length. Each data point represents the mean of two (esk1-5) to six biological replicates. Brackets with different letters indicate genotype groups that are significantly different (P < 0.1), for each segment length except 8 cm, according to Tukey’s multiple pairwise comparisons test. Error bars indicate se. WT, Wild type.

