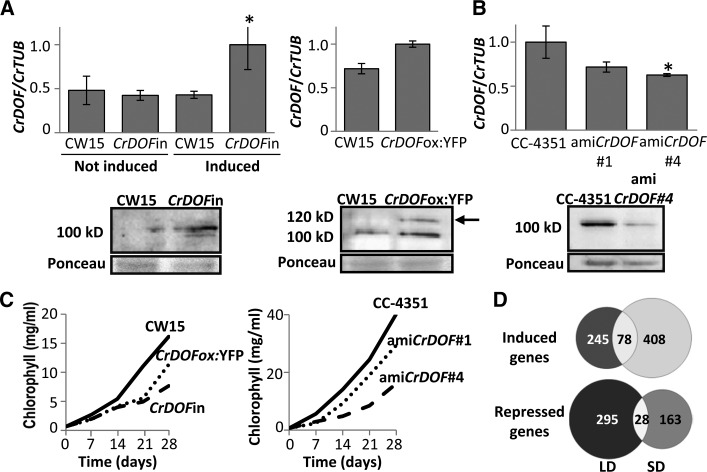
Figure 3.
Altering CrDOF expression affects algal growth. A, CrDOF transcript levels (graphs at top) and protein (immunoblots at bottom) in CW15 and CrDOFin before and after 2 h of induction and CrDOFox:YFP lines at ZT4 in LD. The arrow marks the 120-kD band corresponding to the CrDOF:YFP fusion. B, Reduction in CrDOF transcript levels (graphs at top) and protein (immunoblots at bottom) in amiCrDOF #1 and #4 compared with CC-4351 at ZT4 in LD. *, P < 0.05. C, Growth curves (chlorophyll content) in CW15 (solid line), CrDOFin (dashed line), and CrDOFox:YFP (dotted line) at left and CC-4351 (solid line), amiCrDOF #1 (dotted line), and amiCrDOF #4 (dashed line) at right in a 4-week course. D, Venn diagrams for induced (top) or repressed (bottom) genes from the RNAseq data comparing CW15 and the intersection between CrDOFox:YFP and CrDOFin lines (Supplemental Fig. S1E) in LD (left) and SD (right).

