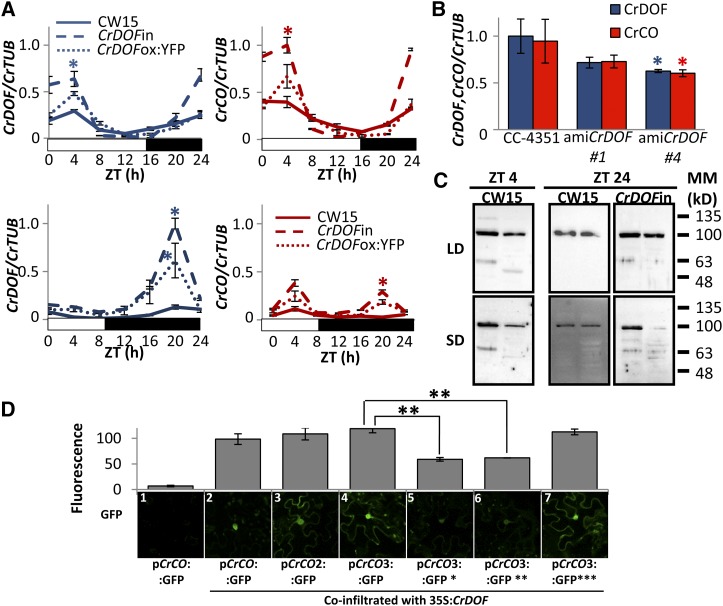
Figure 4.
CrDOF induces CrCO expression. A, A 24-h course of CrDOF (blue) and CrCO (red) expression in LD (top) or SD (bottom) in CW15 (solid lines), CrDOFin (dashed lines), and CrDOFox:YFP (dotted lines). B, Levels of CrDOF (blue columns) and CrCO (red columns) mRNA in CC-4351 and amiCrDOF #1 and #4. Data are from three independent experiments ± se. C, Immunodetection of CrDOF with α-CrDOF in gel filtration fractions 8 (464 kD; left) and 9 (314 kD; right) in protein extracts from cultures in LD (top) or SD (bottom). CW15 at ZT4 (left) and both CW15 and CrDOFin at ZT24 (right) are shown. Black lines are MM markers in kD. D, GFP fluorescence measurements (top) of different pCrCO:GFP constructs in N. benthamiana cells coinfiltrated with 35S:CrDOF. Data are from 100 nuclei in three independent experiments ± se. Results from a significant experiment are shown below each graphic. *, P < 0.05; **, P < 0.01.

