Figure 5.
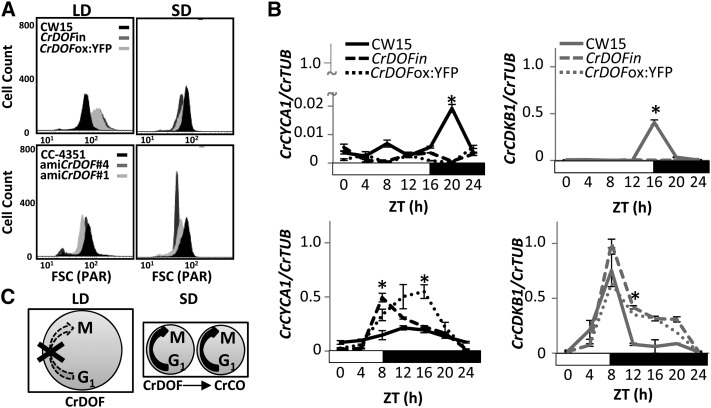
CrDOF controls the C. reinhardtii cell cycle. A, Flow cytometer cell size from algal cultures in LD (left) and SD (right) in CW15 (black), CrDOFin (dark gray), and CrDOFox:YFP (light gray) at top or CC-4351 (black), amiCrDOF #4 (dark gray), and amiCrDOF #1 (light gray) at bottom. B, Expression of CrCYCA1 (black) and CrCDKB1 (gray) in LD (top) and SD (bottom) in CW15 (solid lines), CrDOFin (dashed lines), and CrDOFox:YFP (dotted lines) in 24-h courses. Data are from three independent experiments ± se. *, P < 0.05. C, Scheme of CrDOF control over cell cycle progression in LD (left) and SD (right). Circle size represents algal size, and number of circles represents growth progression.

