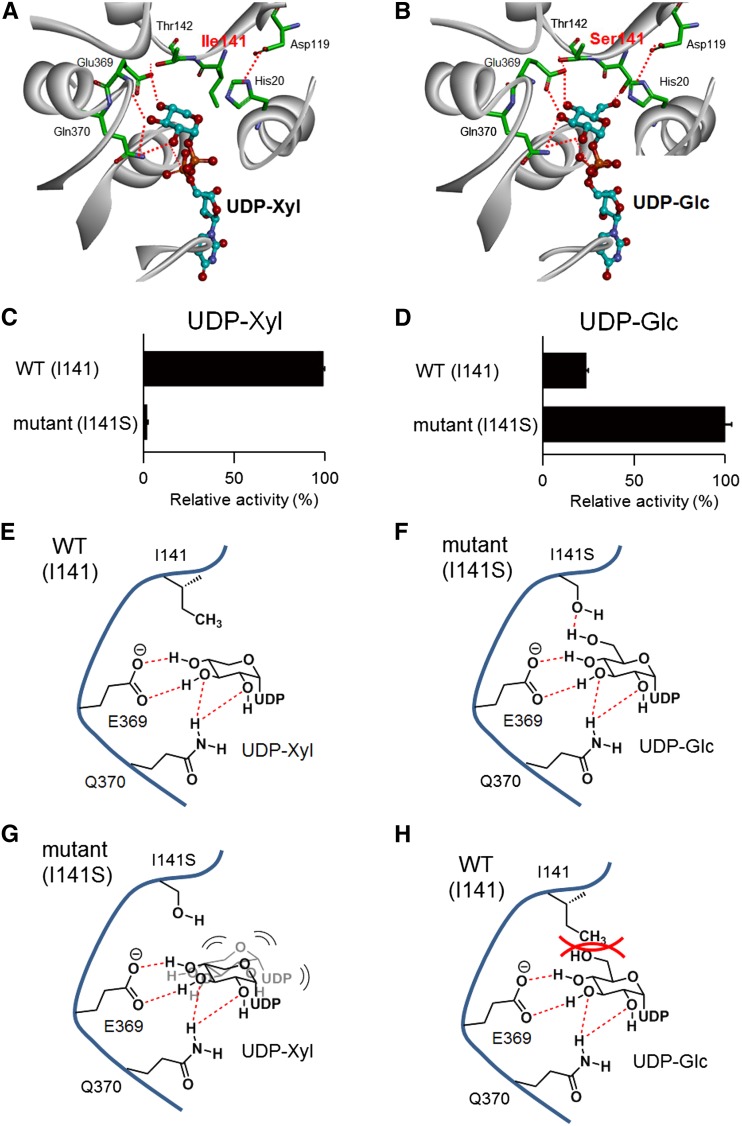
Figure 5.
Structural comparison of the sugar-donor specificity of CsGT2 and its mutant, CsGT2 (I141S). A, Homology model of UDP-Xyl-bound CsGT2. B, Homology model of UDP-Glc-bound CsGT2 (I141S). For the homology models, important amino acid residues on the active site are drawn as the stick form and UDP sugars as the ball-and-stick form. Carbon atoms are colored in green for UGT amino acid residues and in cyan for UDP sugars. Oxygen atoms are red, nitrogen atoms are blue, and phosphorus atoms are orange. Plausible hydrogen bonds are indicated by the red dotted lines. To simplify the visibility of the models, the structure of a sugar acceptor is removed. C, Relative activity of wild-type CsGT2 (WT) and CsGT2 (I141S) toward UDP-Xyl with geranyl-glc as a sugar acceptor. D, Relative activity of wild-type CsGT2 and CsGT2 (I141S) toward UDP-Glc with geranyl-glc as a sugar acceptor. Data are presented as means ± sd (n = 3). E, Schematic representation of UDP sugar recognition of wild-type CsGT2 and UDP-Xyl (schematic model in A). F, Schematic representation of UDP sugar recognition of CsGT2 (I141S) and UDP-Glc (schematic model in B). G, Schematic representation of UDP sugar recognition of CsGT2 (I141S) and UDP-Xyl. H, Schematic representation of UDP sugar recognition of wild-type CsGT2 and UDP-Glc.

