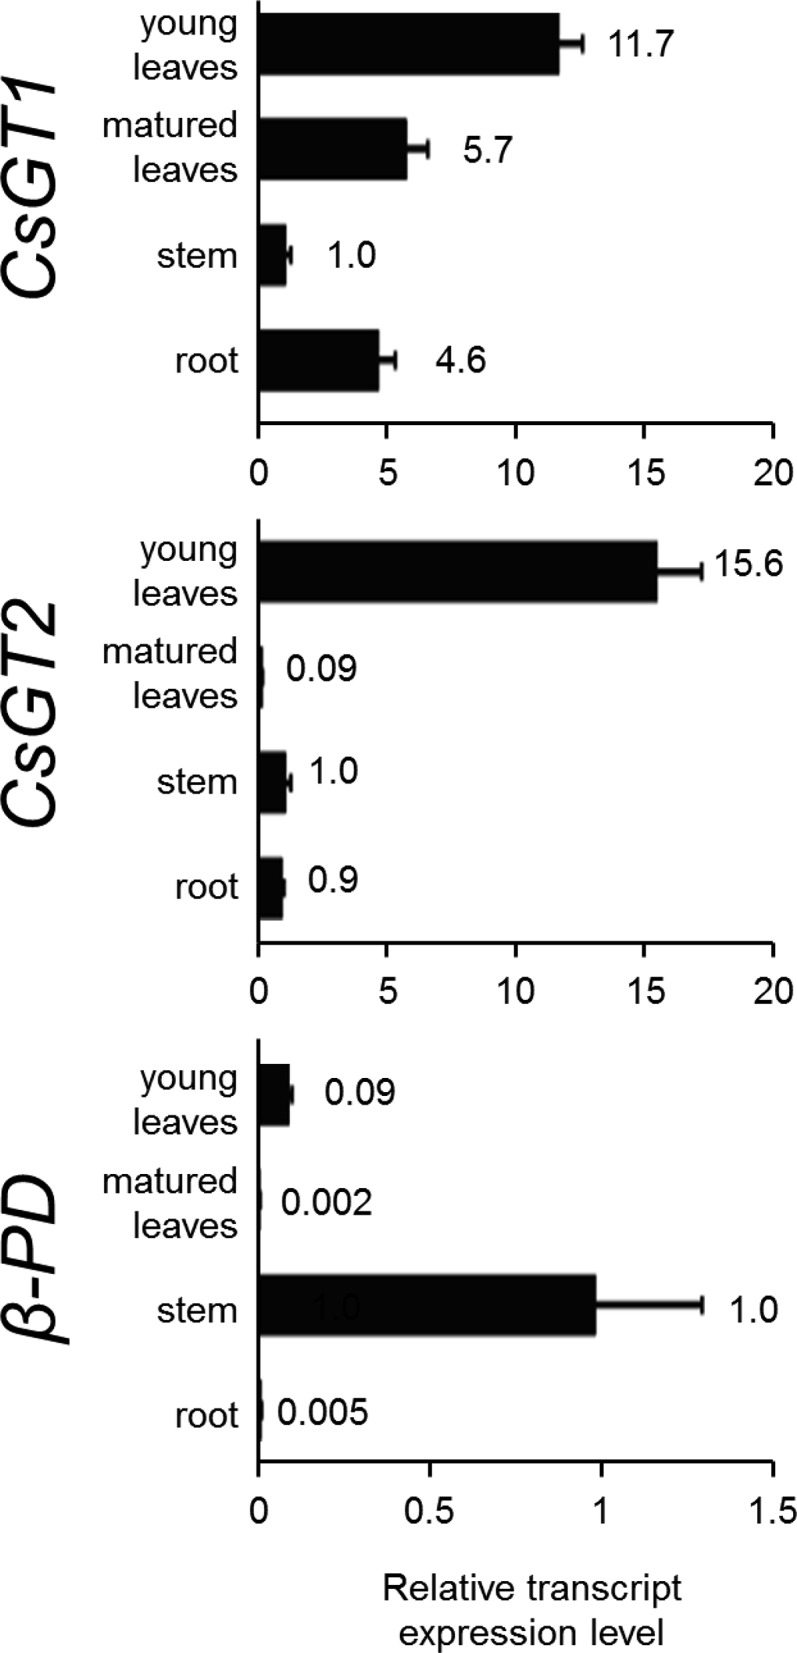
Figure 6.

Relative transcript abundance of CsGT1, CsGT2, and β-PD in various organs (young leaves, mature leaves, stem, root, and flower) of C. sinensis. Transcript abundance was measured by qRT-PCR and normalized to the internal reference 18S ribosomal RNA (18S rRNA). The expression level of each gene in the stem was set at 1. Data are presented as means ± sd (n = 3).
