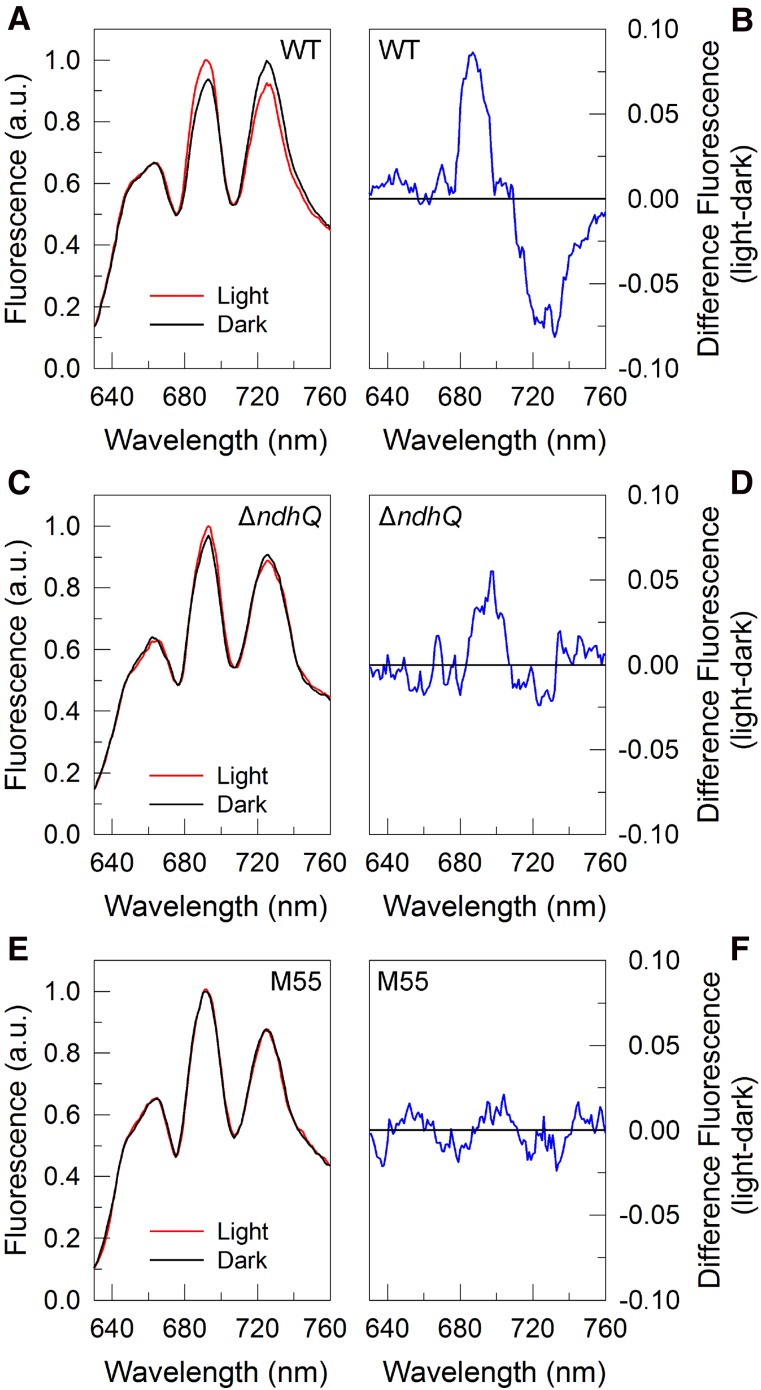
Figure 6.
The 77K fluorescence emission and difference spectra in wild-type (WT), ∆ndhQ, and M55 cells. Fluorescence emission spectra recorded at 77K for intact wild type (A), ∆ndhQ (C), and M55 (E) illuminated under growth light (red line) and incubated in the dark for 10 min (black line). Difference spectra for wild-type, ∆ndhQ, and M55 cells are calculated as light minus dark (B, D, and F). Each spectrum is a mean of six spectra of the same sample in different tubes by exciting phycobilins at 580 nm and normalizing at 707 nm.

