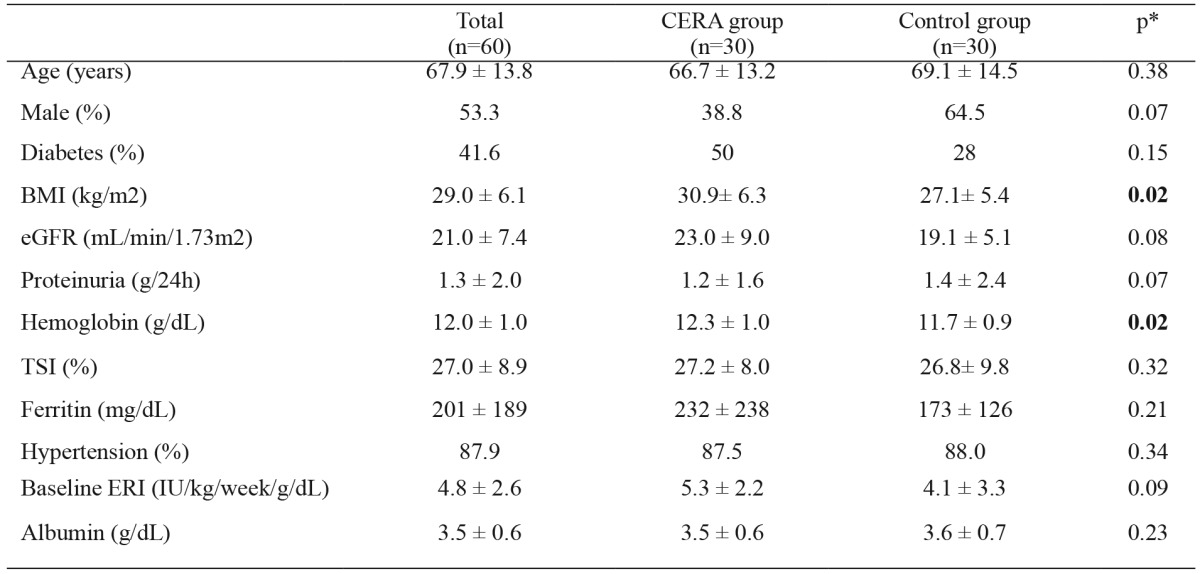
Table 2. Demographic and clinical baseline data of the study group consisting of patients receiving CERA and control group receiving epoetin β and darbepoetin α.

p*: p value between data from CERA and control groups, NS: non significant, CERA: continuous erythropoietin receptor activator, BMI: body mass index, eGFR: glomerular filtration rate, TSI: transferrin saturation index, ERI: erythropoietin resistance index.
