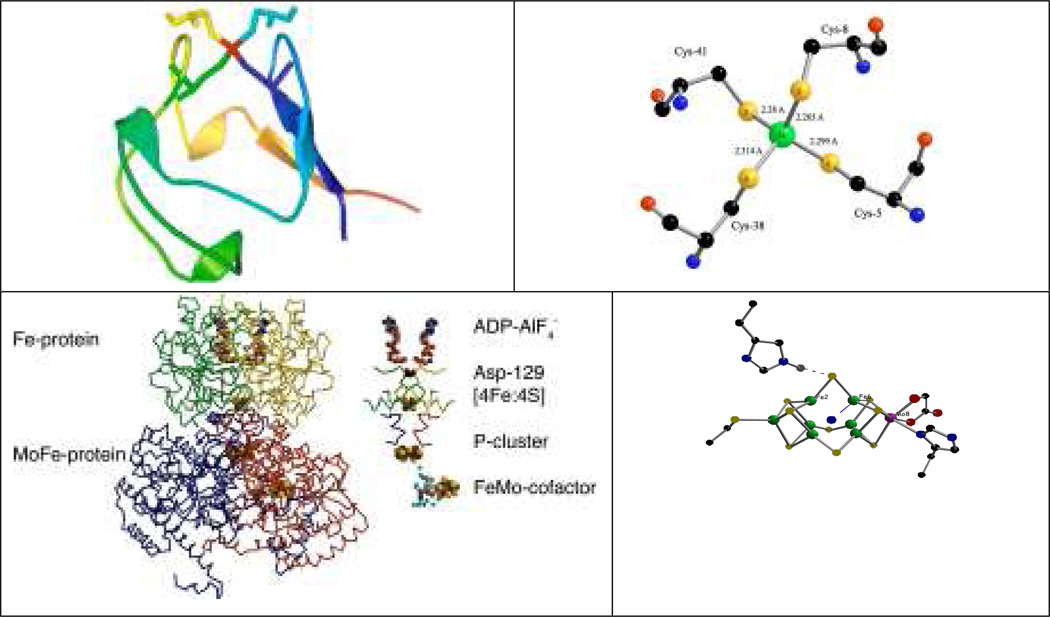
Figure 1.
Top left: a cartoon of oxidized Pf Rd, including sticks for cysteine residues, illustrating exposed location of Fe site (red). Top right: close-up of Fe site showing slight compression of Fe-SCys8 and Fe-SCys41 bonds (PDB Code 1BRF) [2]. Bottom left: N2ase MoFe protein. Bottom right: close-up of FeMo cofactor.

