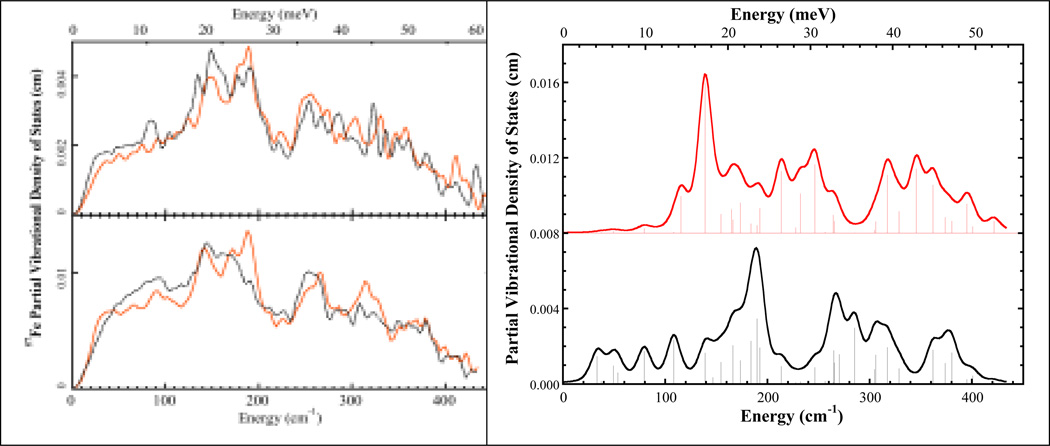
Figure 5.
Left. Top: 57Fe PVDOS for MoFe protein crystal with k̂ ‖ c⃗ (---) and k̂ ⊥ c⃗ ( ). Bottom: MoFe protein in solution (
 ) and P-cluster in ΔnifE MoFe protein (---). Right. Calculated 57Fe PVDOS of FeMo cofactor assuming the C3 axis is parallel to the incident x-ray direction (top) and perpendicular to the incident x-ray direction (bottom). Sticks represent intensities of individual normal modes.

