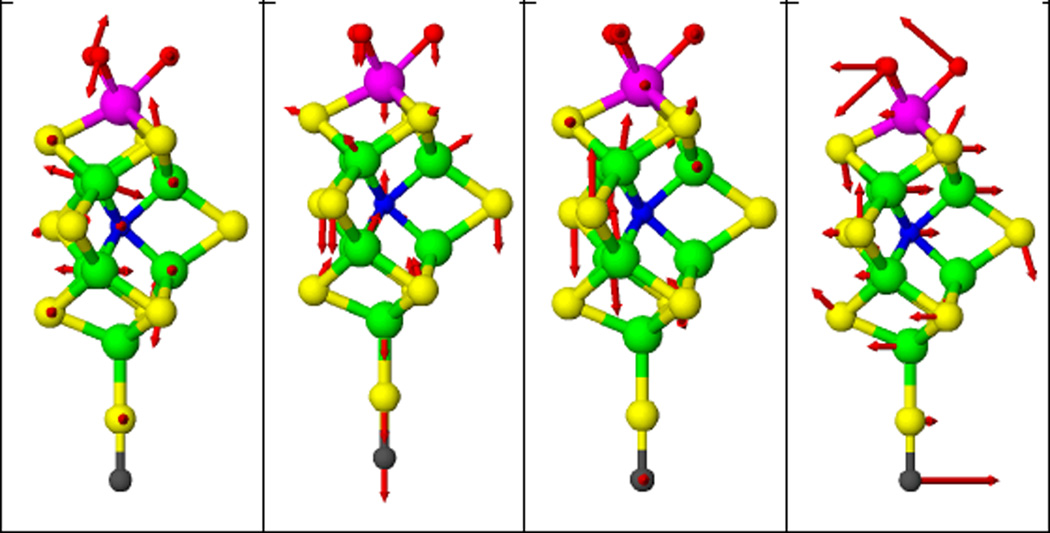
Figure 6.
Illustration of molecular motion in FeMo cofactor normal modes, derived from the normal mode calculation using a C3v symmetry [O3MoFe7NS9(SC)]n− FeMo cofactor model (2). Color code: Fe (green), S (yellow), Mo (magenta), O (red), C (black). Left to right: at 188, 177, 141, and 85 cm−1 Figures were made with ATOMS.

