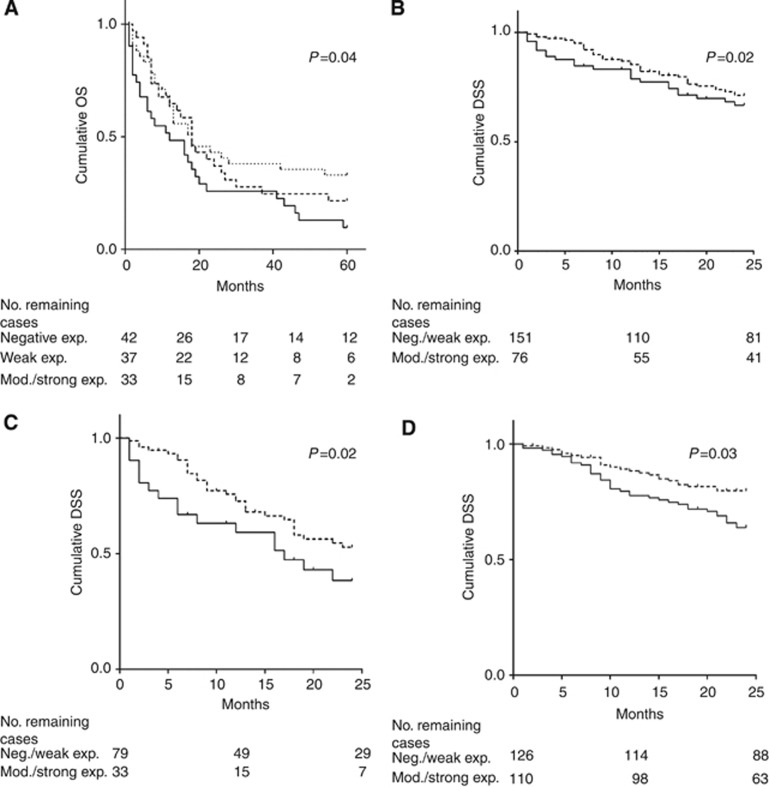
Figure 2.
Kaplan–Meier plots describing the correlation of STMN1 to survival. In advanced bladder cancer patients (cohort I), STMN1 overexpression was correlated to shorter (A) OS in T2–T4 patients and to shorter (B) DSS in T1–T4 patients. In cohort I (C) as well as in cohort II (D) T2–T4 patients with moderate/strong STMN1-expressing tumours had a higher risk of cancer-specific death within 2 years. Log-rank test results are displayed for each Kaplan–Meier plot. The P-values are the adjusted values from the multivariate analyses, correcting for stage, age and gender. (Negative exp.=dotted line, neg./weak or weak exp.=dashed line and mod./strong exp.=solid line.)

