13.

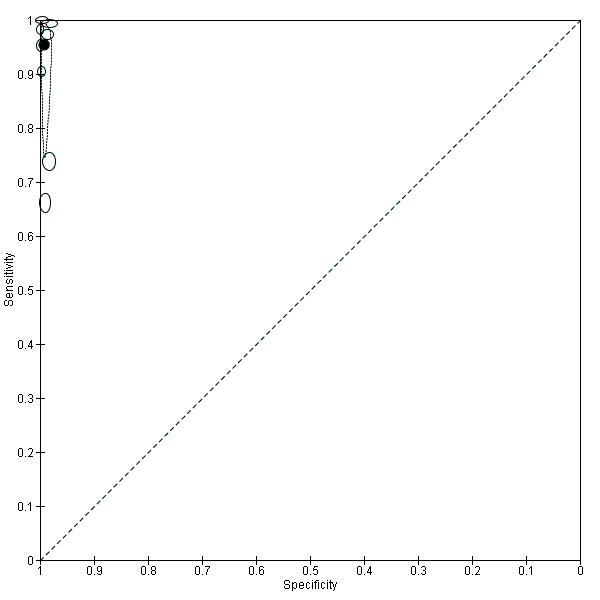
Summary ROC plot Pf HRP‐2 and Pv pLDH for detection of P. vivax (verified with microscopy). The black circle corresponds to the summary estimate of sensitivity and specificity, and is shown with a 95% confidence region.

Summary ROC plot Pf HRP‐2 and Pv pLDH for detection of P. vivax (verified with microscopy). The black circle corresponds to the summary estimate of sensitivity and specificity, and is shown with a 95% confidence region.