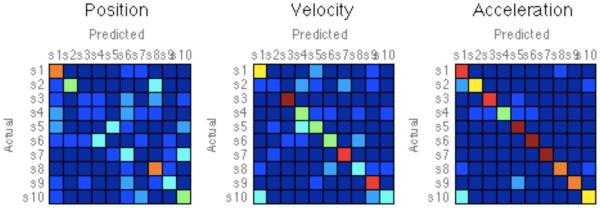
Fig. 5.

Confusion matrices of distribution profiles for 10 subjects, for acceleration, velocity, and position data. Red/Blue indicates probability that each subject’s histogram for half of the data as a predictor for the other half of data. These results show a general trend of distinct movement distributions per subject.
