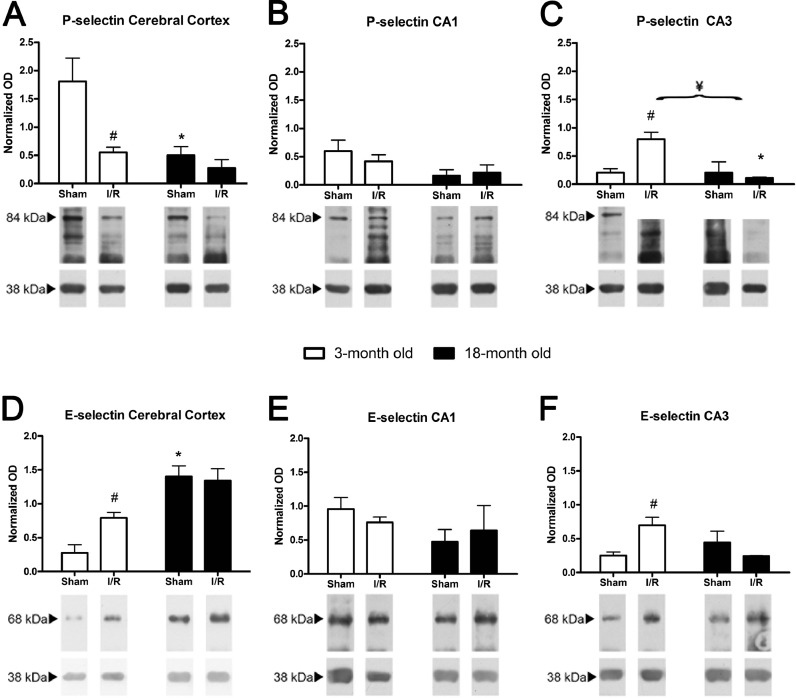
Fig. 3.
Effect of age and I/R on selectin protein levels. Representative protein bands of P-selectin (84 kDa) and E-selectin (67 kDa) in the CX (a and d), CA1 (b and e) and CA3 (c and f) in young (open columns) and old animals (black columns). The averages of the densitometric analysis corresponding to five rats (mean ± SEM) normalised to respect to β-actin (40 kDa) are indicated above the bands. Age-dependent significant differences are represented by an asterisk, I/R-dependent significant differences are represented by a number sign and significant interactions between and age and I/R are represented by a yen sign (p < 0.05, two-way ANOVA, n = 5)

