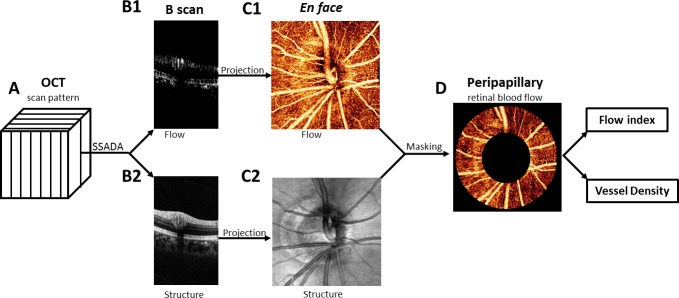
Figure 1.

The horizontal and vertical scans were registered and merged to obtain one motion- corrected 3D data cube (A). The SSADA algorithm was used to compute flow (B1) and structural (B2) B-scan images. The en face OCT angiogram (C1) is produced by maximum flow projection of the retinal layer and the optic disc. The en face OCT structure (C2) is produced by averaging the signal intensity in each axial scan. The peripapillary region was delineated on the OCT structural image as a 700-μm-wide elliptical annulus extending outward from the optic disc boundary (C2). The peripapillary region of the en face OCT angiogram (D) was used to compute the flow index and vessel density index.
