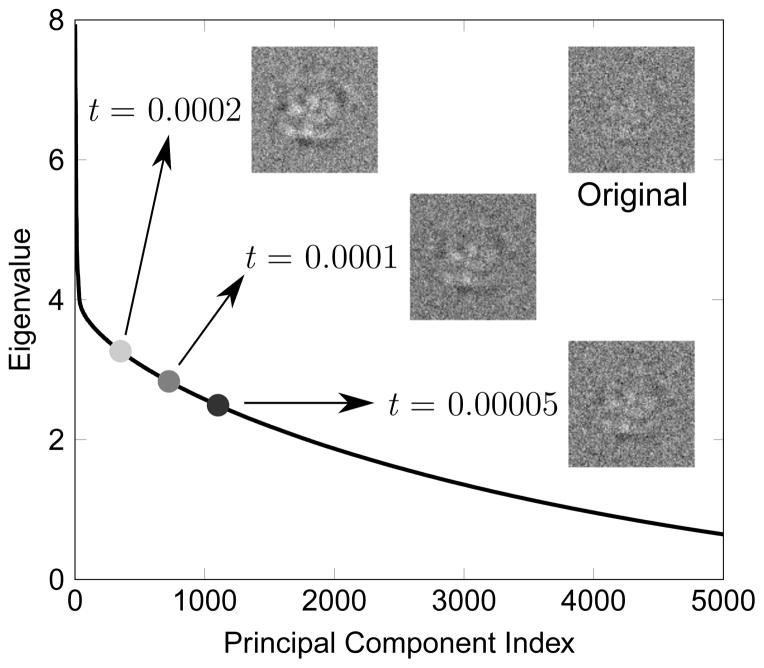
Fig. 3.
Plot of eigenvalues from PCA of simulated cryo-EM data. The number of components for various values of the threshold t are noted along with corresponding approximated images for the sample particle image in the upper right. The particle image intensities are first normalized to have mean of zero and standard deviation of one before performing PCA.

