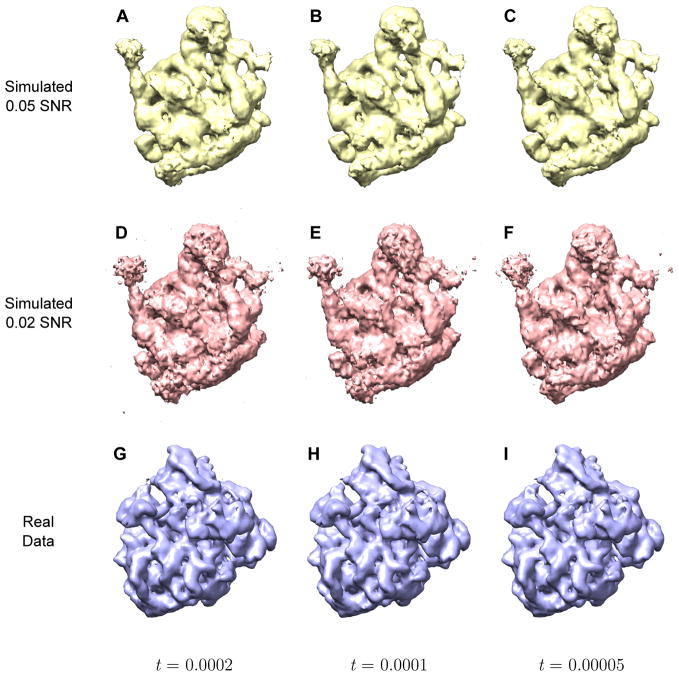
Fig. 7.
SubspaceEM reconstructions using different values for the threshold t. Each row corresponds to reconstructions using the same dataset, with number of basis components used increasing from left to right. (A) Simulated 0.05 SNR, t = 0.0002. (B) Simulated 0.05 SNR, t = 0.0001. (C) Simulated 0.05 SNR, t = 0.00005. (D) Simulated 0.02 SNR, t = 0.0002. (E) Simulated 0.02 SNR, t = 0.0001. (F) Simulated 0.02 SNR, t = 0.00005. (G) Real data, t = 0.0002. (H) Real data, t = 0.0001. (I) Real data, t = 0.00005.

