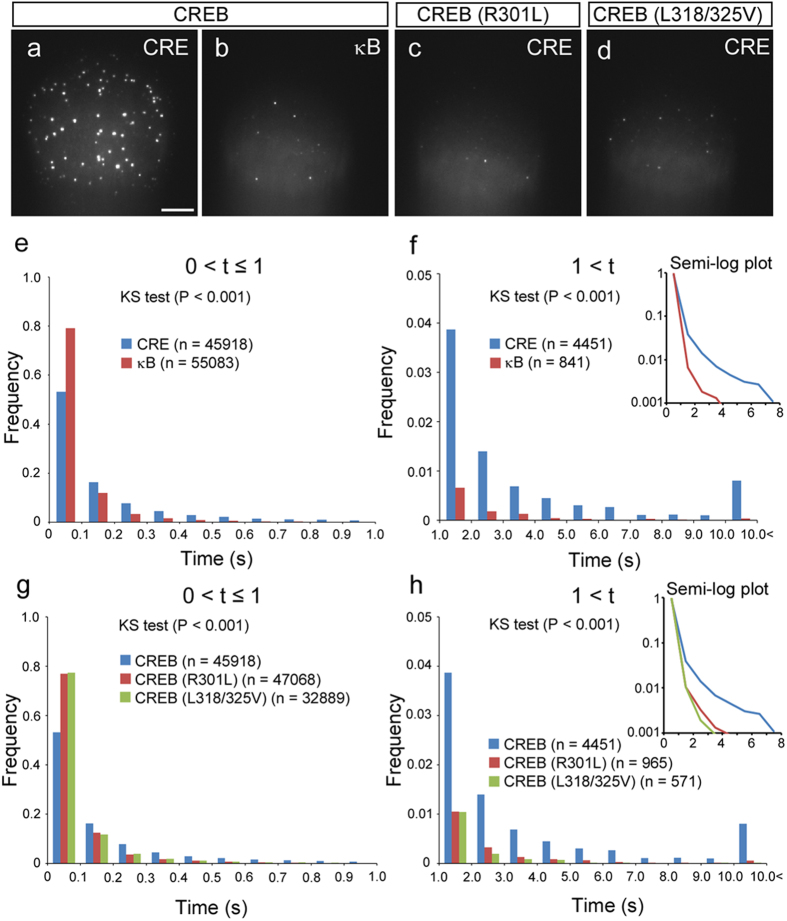
Figure 2.
Individual interaction between CREB and CRE in vitro. (a,b) TIRF images show individual TMR-CREB spots interacting with CRE sequence (a; the same image in Fig. 1b) and κB sequence (b). Scale bar: 10 μm. (c,d) TIRF images of TMR-mutant CREB (R301L and L318/325V) interacting with CRE sequence. (e,f) Quantitative analysis of the residence time of CREB spots interacting with CRE and κB sequences. (e) and (f) show distribution histograms for short (≤1 s) and long (>1 s) residence times of TMR-CREB, respectively. The number of TMR-CREB spots analyzed is presented in parentheses. The Kolmogorov-Smirnov (KS) test showed that the difference between the two distributions (CRE vs. κB) is significant (P < 0.001). (g,h) Quantitative analysis of the residence time of mutant CREB spots interacting with CRE sequence. (g) and (h) show distribution histograms of short (≤1 s) and long (>1 s) residence times of the spots, respectively. The number of TMR-CREB spots analyzed is presented in parentheses. The distribution of wild-type CREB is significantly different from those of the mutants (KS test, P < 0.001).

