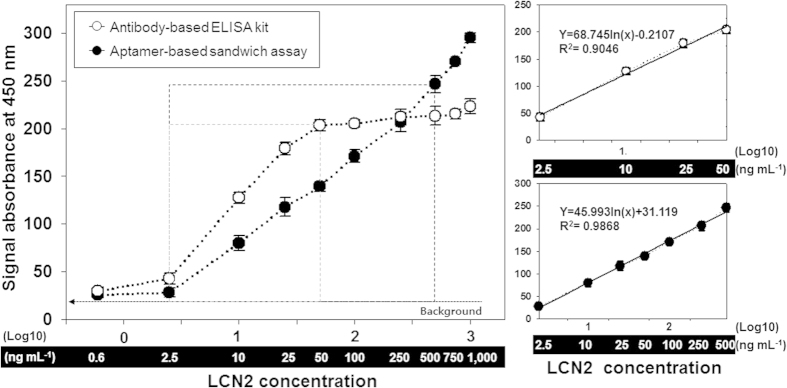
Figure 4. Broad linear regression of the aptamer-linked sandwich assay.

A series of samples containing LCN2 (0.6, 2.5, 10, 25, 50, 100, 250, 500, 750 and 1,000 ng mL−1) was prepared and assayed with both aptamer and antibody-based sandwich (ELISA kit) platforms. The background is defined as the average signal from the LCN2 absence (0 ng mL−1), and the error bars represent the standard deviation. The concentration range of 50–500 ng mL−1 indicates a critical detection area of the aptamer assay for LCN2 (serological LCN2 value, see Table 2). The part highlighted with a gray box in the graph (2.5 ~50 ng mL−1) indicates a linear dynamic range of ELISA with the equation, Y = 68.745ln(x)-0.2107 (R2 = 0.90). The result of the aptamer sandwich construction shows that LCN2 was sensitively detected in the linear dynamic range of 2.5 ~ 500 ng mL−1 with the equation Y = 45.993ln(x) + 31.119 (R2 = 0.99).
