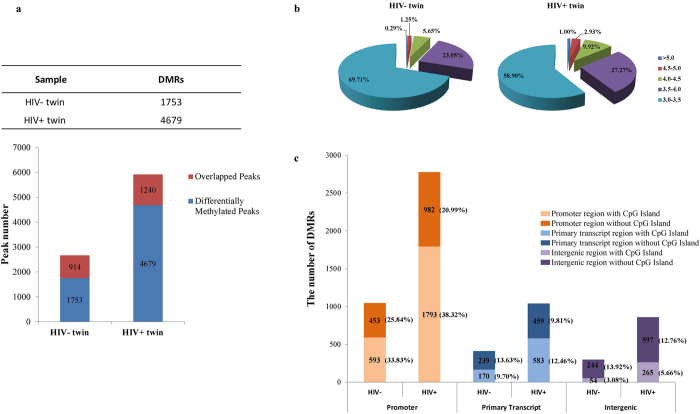
Figure 1. Data analysis of methylation microarray.
(a) The differential methylation regions (DMRs) in both twins. The red bar indicated the overlapped methylation regions while the blue bar indicated the differentially methylation regions. A total of 4679 DMRs were found in HIV positive twin and 1753 DMRs in the HIV negative twin. (b) Numbers of high value DMRs in the genome-wide DNA methylation profiles in both twins at different value range. It was assumed that high value DMRs have the peak values over 3.0. (c) Numbers of DMRs at different distance range from transcription start sites in both twins. DMRs were divided into 3 categories according to their location from the genes they were mapped to. Numbers in the parentheses indicate the percentage.

