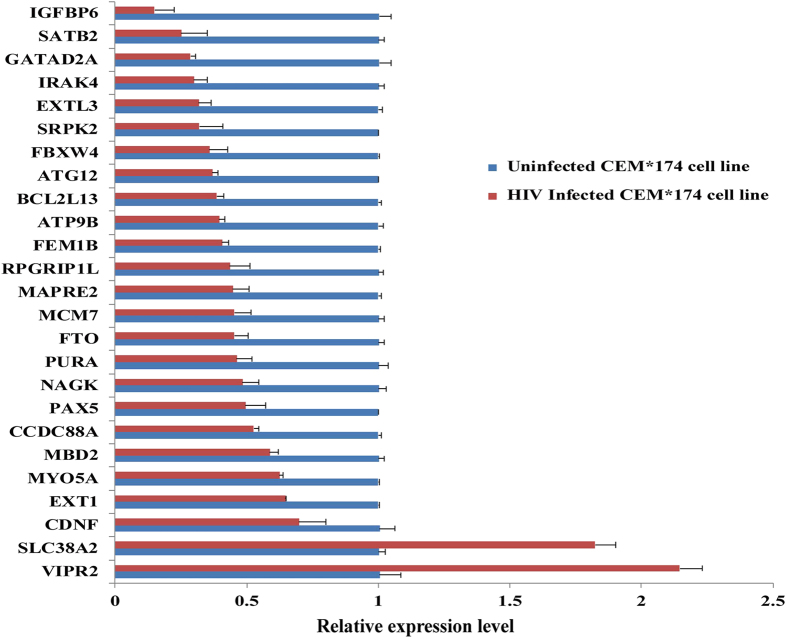
Figure 2. Relative transcript level of 25 genes in CEM*174 T cell line before and after HIV infection.
The mRNA expression level of selected genes were determined and normalized with β-actin mRNA. Results were given as fold change in mRNA expression with ± SD. Independent experiments were repeated three times.

