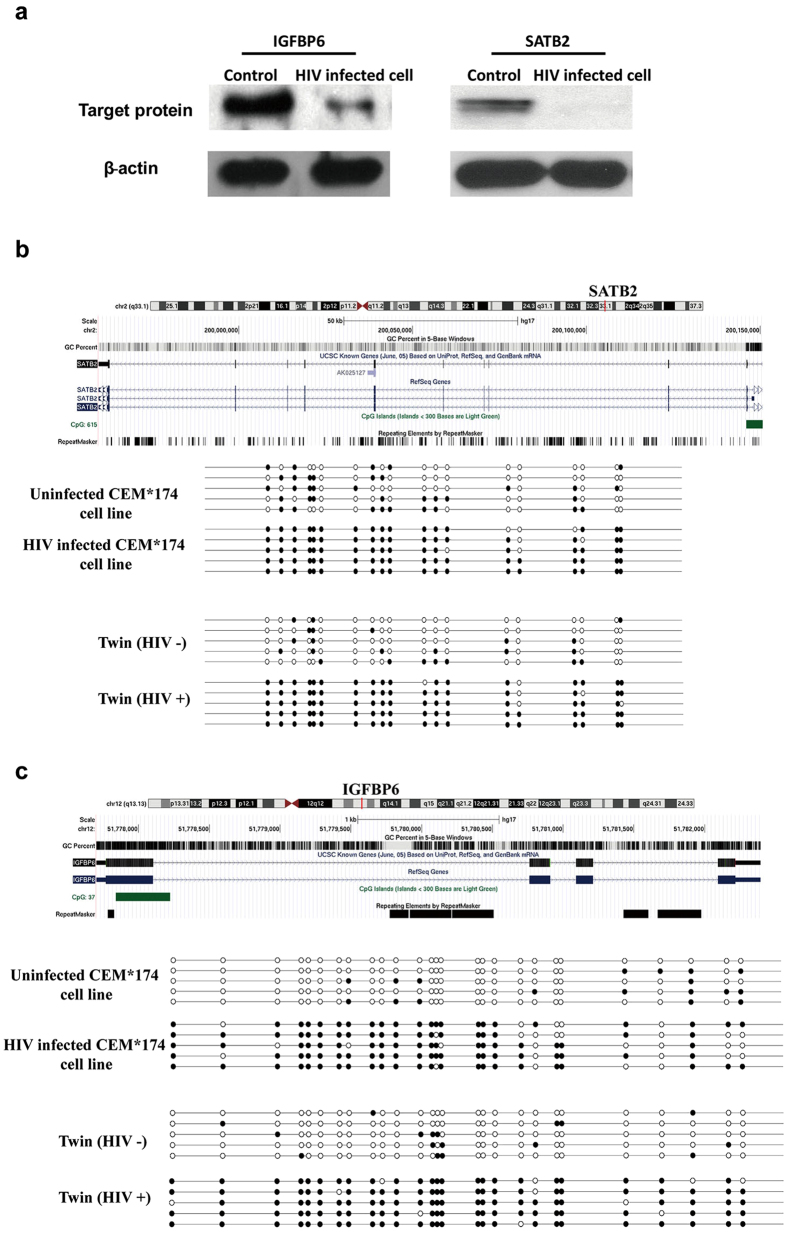
Figure 3. The expression level and methylation status of 2 target genes in CEM*174 T cells.
(a) Western blotting result of IGFBP6 and SATB2 in HIV infected/uninfected CEM*174 cell lines. Full-length blotting images are presented in Supplementary Figures. The bisulfite sequencing result of (b) SATB2, (c) IGFBP6 in HIV infected/uninfected CEM*174 cell lines and both twins were shown. Solid circle represented methylated CpG islands; Open circle represented unmethylated CpG islands.

