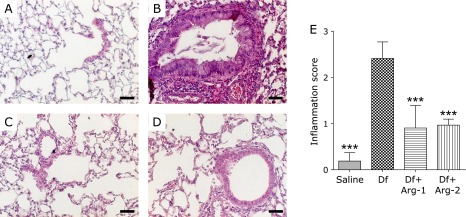
Fig. 4.

The effect of Arg on histopathological inflammation in the mite-induced asthmatic lung. Representative images of hematoxylin and eosin-stained lung tissue from the saline (A), Df (B), Df + Arg1 (C), and Df + Arg2 groups (D), and inflammation scores (E) are shown. The bars indicate 50 µm. ***p<0.001 vs the Df group based on one-way ANOVA followed by Tukey’s multiple comparison test (n = 8 mice/group).
