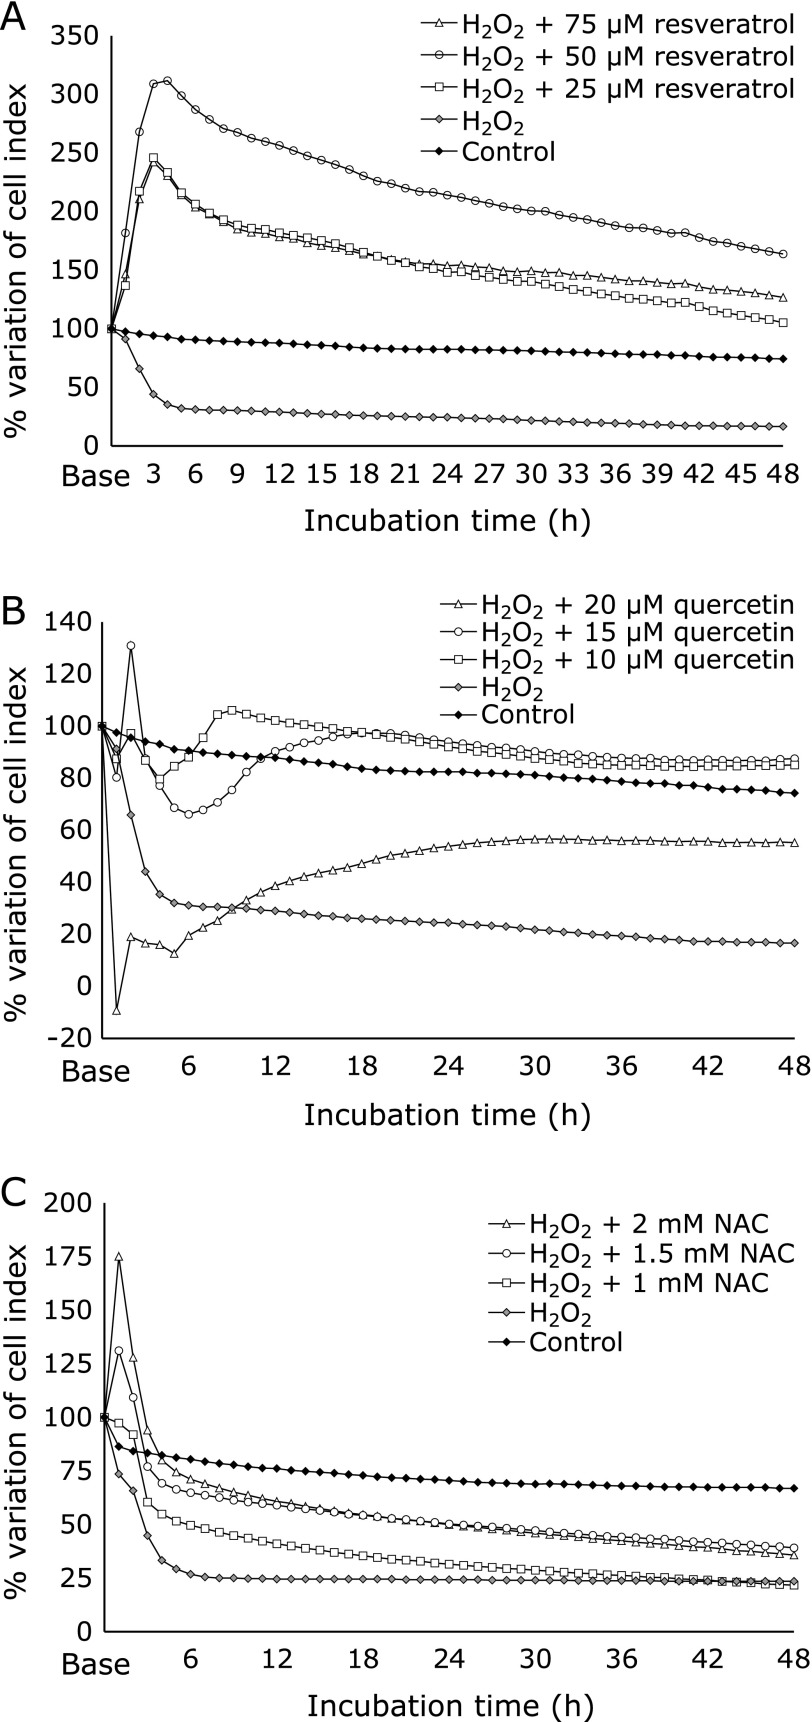
Fig. 1.
Dynamic monitoring of cell viability and proliferation expressed as a cell index (CI) by xCELLigence system. HGFs (10,000 cells/well) were exposed to H2O2 (0.23 mM) to induce oxidative stress and treated with different concentrations of (A) resveratrol, (B) quercetin, and (C) NAC for 48 h. The percentage of variation of CI represents the changes recorded in CI values compared to the Base value. The graph shown is the result of the mean of three independent experiments (n = 6).

