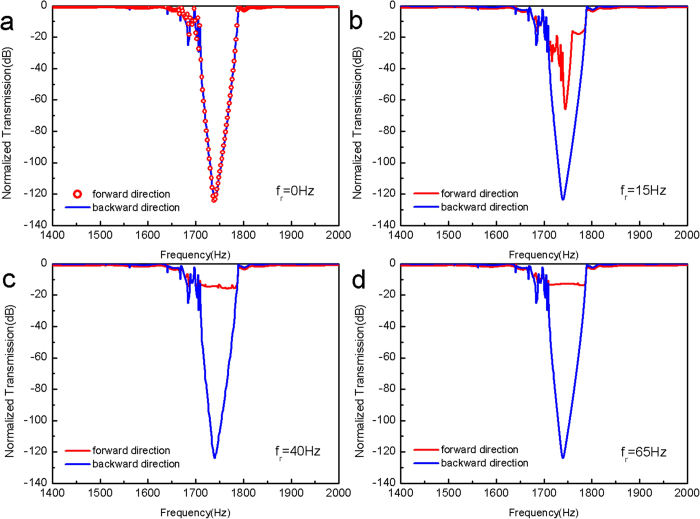
Figure 3. Full-wave simulation results for acoustic transmission through our designed system.
(a) Normalized transmission spectra when blade is at rest with rotating frequency fr = 0. The spectra for forward and backward propagation directions are nearly identical within the numerical error in the simulation, and they correspond to the filter’s intrinsic frequency response. In this case, the system transmission property is symmetric. (b–d) Normalized transmission spectra corresponding to three different excited states/rotating frequencies of the blade: (b) fr = 15 Hz, (c) fr = 40 Hz, (d) fr = 65 Hz. With the increasing rotating frequency of the blade, the system starts to develop asymmetric response with increasing power transmission for the forward propagation direction but almost unchanged power transmission power for the backward propagation, which leads to an increased power transmission contrast ratio for these two propagation directions. At fr = 15 Hz asymmetric transmission is observed primarily for input frequency near the center of the filter’s stop-band, while at higher frequencies fr = 40 Hz and fr = 65 Hz asymmetric frequency response occurs for most of input frequencies falling into the filter’s stop-band. At the highest rotation frequency of fr = 65 Hz used in our experiment, the power transmission contrast ratio is close to 100 dB.

