
Figure 7. Changes in the Pt concentrations in blood upon Intralipid pre-treatment during 72 hr.
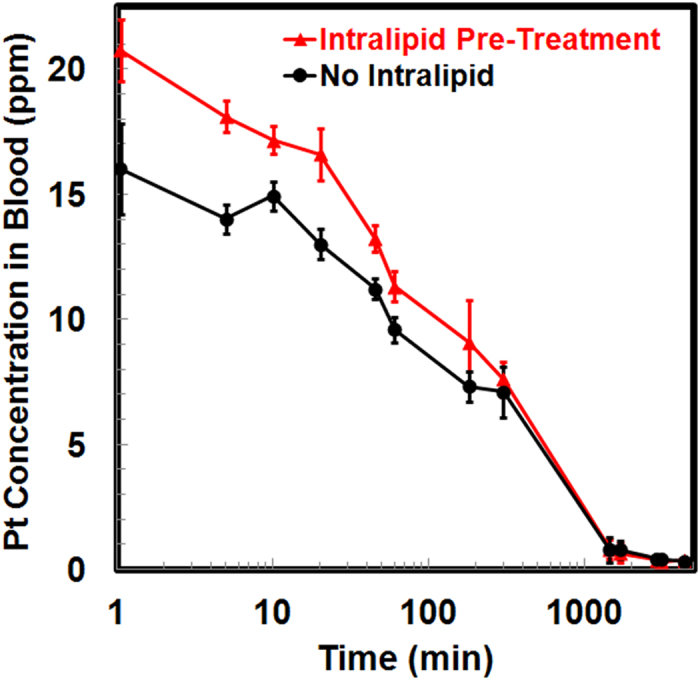
X-axis represents the duration post DACHPt/HANP injection, in logarithmic scale (base: 10).
Official websites use .gov
A
.gov website belongs to an official
government organization in the United States.
Secure .gov websites use HTTPS
A lock (
) or https:// means you've safely
connected to the .gov website. Share sensitive
information only on official, secure websites.
X-axis represents the duration post DACHPt/HANP injection, in logarithmic scale (base: 10).