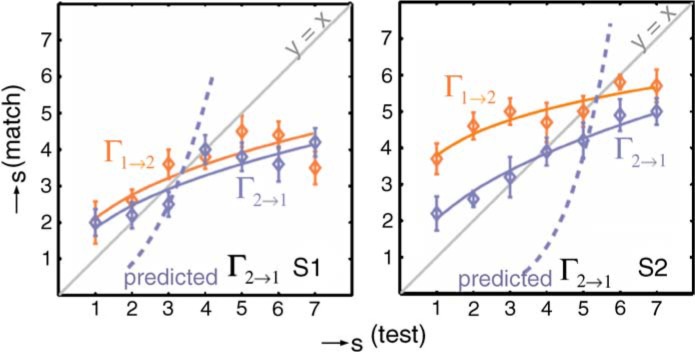
Figure 5.

Data for two representative observers collected with the method of adjustment. The letter ρ s denotes the magnitude of the specularity component in the Ward model (Ward, 1992). The lines are least square fits of the form Γ(g) = agb to the points of perceived equal gloss. we measure Γ1→2 and Γ2→1. It becomes apparent that the inverse of Γ1→2 does not agree with the function Γ2→1. We abandoned this method because of the evident, strong response bias.
