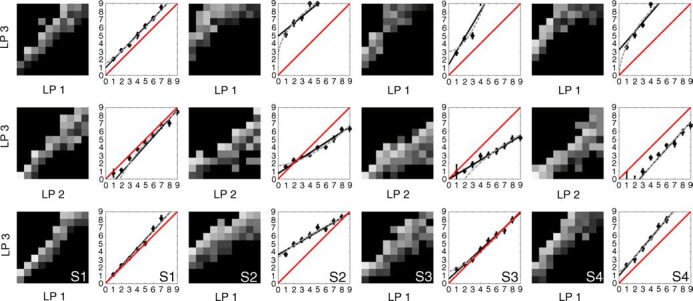
Figure 7.
Data for 4 observers. Each observer (S1–S4) has 2 columns. In the left column for each observer preference matrices are shown. Values larger than zero (black) indicate where staircase data was collected and the gray-level indicates the percent judged glossier, brighter values denoting a higher percentage. In the right columns diamonds are the estimated points of perceived equal glossiness. Standard deviations are obtained by bootstrap analysis of the estimation procedure. The black solid lines are the best linear model fit obtained by MLE. The light grays dashed lines are the best power model fit obtained by MLE. The red lines correspond to the identity model.

