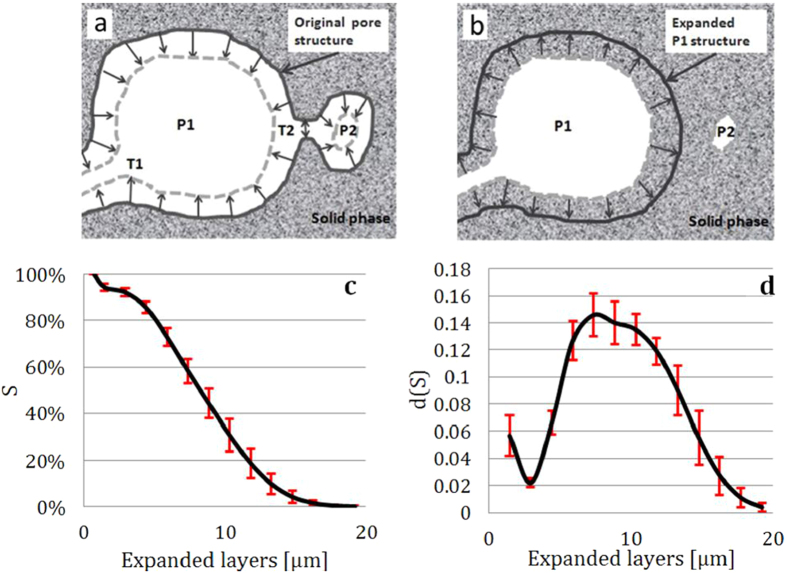
Figure 4.
Schematic illustration of the quantitative evaluation of the pore structure using the proposed solid expansion and contraction method is shown in panels (a) and (b). Panel (c) shows the plot of the normalized accessible pore volume (the saturation percentage) versus the pore throat. The differential plot of panel (c) is shown in panel (d). The error bar is determined by analyzing the standard deviation of the experimental data from the tomographic measurement of different areas of the sample.

