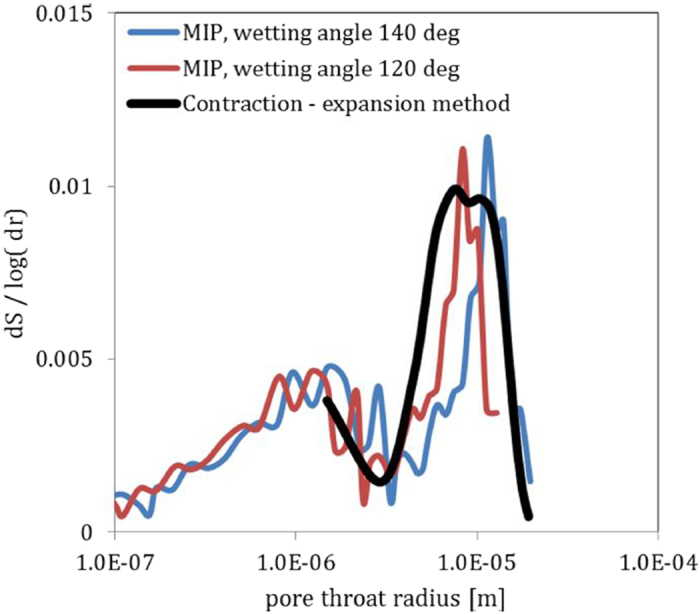
Figure 6.

A change of wetting angle translates into a shirt of the computed pore throat radius distribution towards smaller radii. Given in blue is the curve computed form experiment 1 (Fig. 5) using a wetting angle of 140 degree. The red curve uses the same experimental values, but employs a wetting angle of 115 degree in the Laplace-Young equation. The values coming from the solid contraction and expansion method are given in green.
