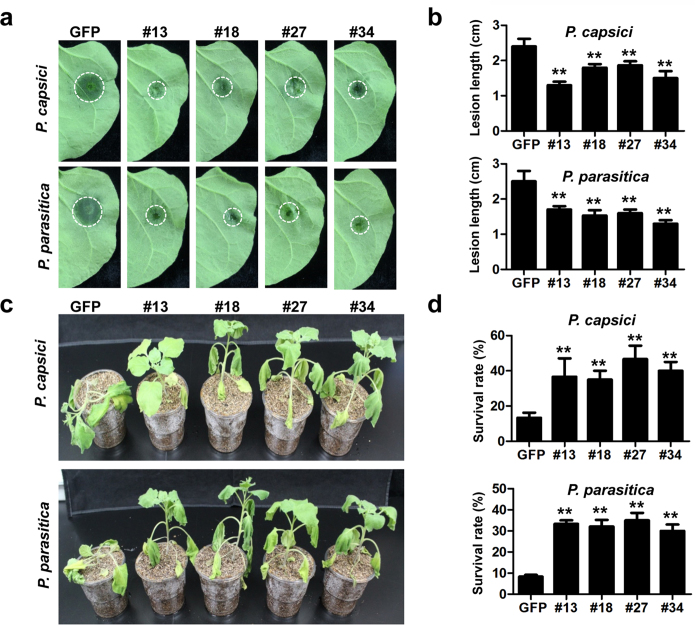
Figure 3. Enhanced resistance to Phytophthora pathogens in PsCRN115-transgenic plants.
(a) Leaf phenotypes upon Phytophthora infection. Detached leaves of GFP- and PsCRN115-transgenic plants were inoculated with P. capsici or P. parasitica zoospores. The representative photographs were taken at 36 hpi. (b) Average lesion diameters of the inoculated leaves. Error bars represent standard errors calculated from at least 10 independent biological replicates. Asterisks indicate significant differences determined using Dunnett’s test (P < 0.01). (c) Phenotypes of the inoculated plants. A total of 5 mL of P. capsici or P. parasitica zoospores (100 μL−1) were dipped into the soils. The photographs were taken at 4 dpi. (d) Survival rates of the inoculated plants. The rates were measured at 4 dpi. The experiments were repeated four times with similar results. A total of 20 plants for each line were used for inoculation assays. Bars represent the standard errors. Different letters above bars indicate statistical significance (**, P < 0.01, Dunnett’s test).

