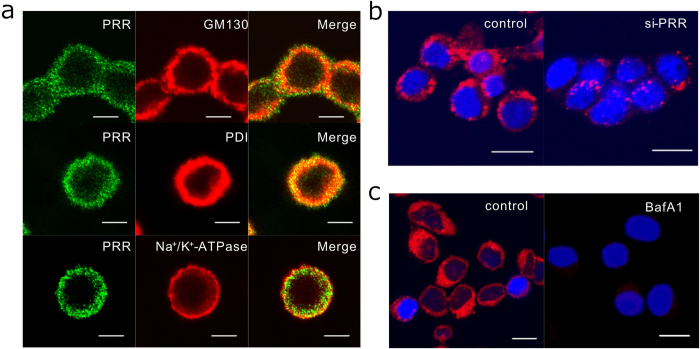
Figure 2. Subcellular PRR localization and acidic organelle in GH3 cells by immunofluorescence analysis.
a Immunofluorescent stainings using antibodies against PRR (green) (left panels), GM130, PDI, and Na+/K+-ATPase (red) (middle panels), and the merged images (right panels) are shown. Scale bar, 5 μm. b Acidic organelles were labeled using LysoTracker (red) in GH3 cells transfected with scramble control siRNA (control) or with PRR si-RNA (si-PRR) for 30 min. Scale bar, 10 μm. c Acidic organelles were detected in GH3 cells pretreated without (control) or with bafilomycin A1 (BafA1, 100 nM) for 30 min. Scale bar, 10 μm.

