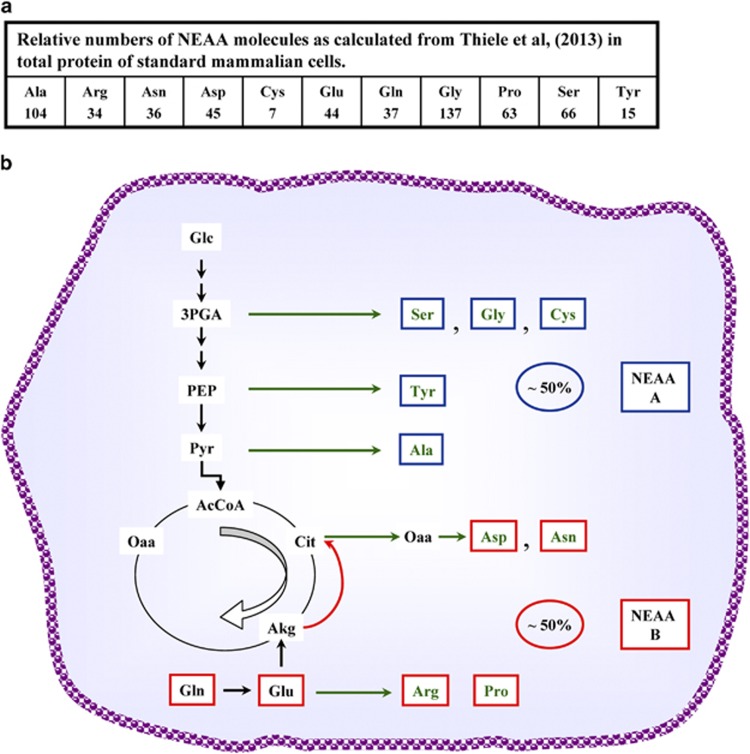
Figure 3.
Schematic representation of NEAA synthesis. (a) Schematic fractional contribution of each amino acid in total protein and the corresponding number of molecules calculated for each NEAA that have to be obtained from metabolism. (b) Schematic representation of NEAA synthesis derived from glutamine utilization in cancer cells

