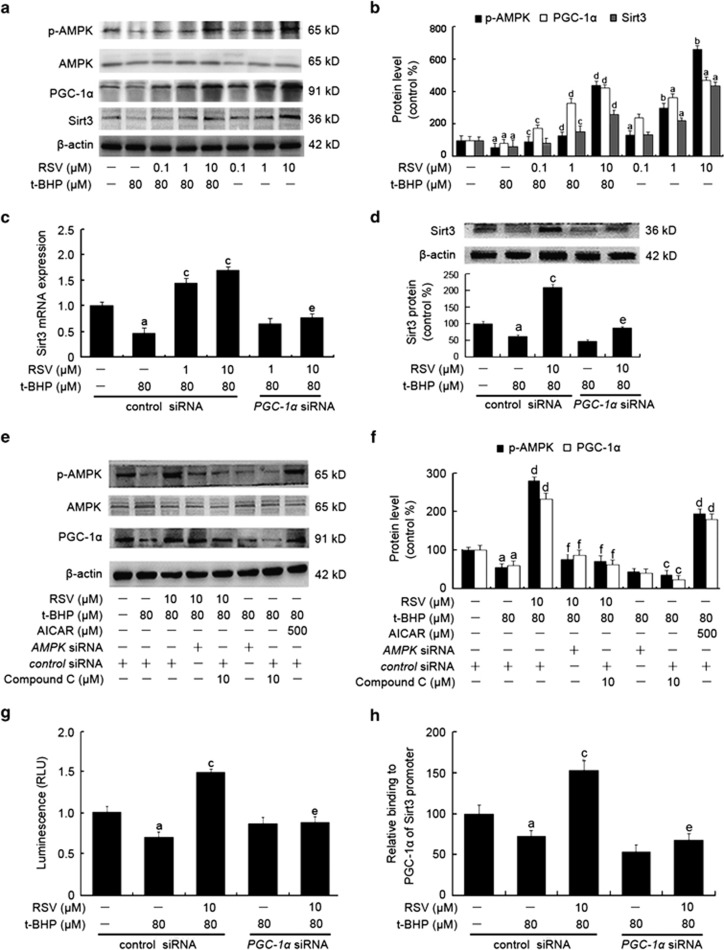
Figure 6.
RSV stimulated AMPK-PGC-1α-ERRα-Sirt3 signaling pathway in HUVECs. (a) Cells were pretreated with RSV (0.1, 1 and 10 μM) for 2 h and then treated with or without t-BHP of 80 μM for an additional 4 h. The cells were harvested and lysed to detect protein levels of AMPK, p-AMPK, PGC-1α and Sirt3 by western blot assay. (b) The bar charts show quantification of the indicated proteins. Cells were transfected with PGC-1α siRNA as described in the Materials and Methods section. (c) The mRNA levels of the Sirt3 genes were determined by real-time PCR assay. (d) The cells were collected and lysed, and Sirt3 protein levels were detected by western blot analysis. Cells were preincubated with compound C (10 μM), AMPK siRNA or AICAR (500 μM) as described in the Materials and Methods section. Then cells were pretreated with RSV of 10 μM for 2 h, followed by incubation in the presence or absence of t-BHP of 80 μM for an additional 4 h. (e) The expressions of AMPK, p-AMPK and PGC-1α were measured by western blot. (f) The bar charts show quantification of the indicated proteins. Cells were transfencted with PGC-1α siRNA as described in the Materials and Methods section. At 24-h post-transfection, the cells were pretreated with RSV of 10 μM for 2 h and then treated with or without t-BHP of 80 μM for an additional 4 h. (g) Cells were harvested using ChIP assay, and real-time PCR assay was carried out using primers specific to the Sirt3 promoter. The results were determined relative to those of the total input controls (untreated chromatin). (h) Cells were co-transfected with pRL-TK reporter plasmid supplemented with ERRE-luc or NEG-PG04 (vehicle control), respectively. ERRα was knocked down by ERRα siRNA transfection, as described in the Materials and Methods section. And then cells were pretreated with RSV of 10 μM for 2 h, followed by treatment with or without t-BHP of 80 μM for an additional 4 h. Both firefly and Renilla luciferase activities were measured sequentially using the Dual-Glo luciferase reporter assay system. All results are presented as means±S.E.M. of at least three independent experiments. aP<0.05, bP<0.01 versus the control group; cP<0.05, dP<0.01 versus t-BHP-treated group; eP<0.05, fP<0.01 versus RSV (10 μM) and t-BHP (80 μM) co-treated group with control siRNA transfection

